3
0
I want to make Excel chart that shows my accounts' balances in time.
I have 2 bank accounts and I have all transactions saved in Excel. The data's format is:
Column A   Column B   Column C   Column D   Column E
Date_1     Balance_1  [blank]    Date_2     Balance_2
Dates are random (there could from 1 to 40 transactions per month).
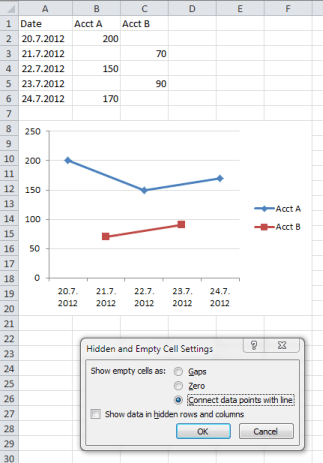
My problem is that I don't know how to make the X-axis show date (linear, not from the data) and then show appropriate balance on the Y-axis. I mean that X-axis should show each day even though there is no transaction, so each month should have same length. (This problem isn't shown in the example.)
The main problem is that both accounts have transactions dated differently and that shouldn't be a problem in the chart - I need to make these points independent of the other account. There are thousands of transactions, I can't resolve this problem by adding duplicate dates and balances so their count matches.
Sorry for my English, I really try to make it clear though, hope you can help me.
Thanks for the advice!

Kamil
Posted 2012-07-29T16:38:46.660
Reputation: 31