1
0
I am doing a physics project. I have made experiments with free-fall, and I have a time-velocity graph which I built. The slope of each point in the graph is the acceleration. The acceleration in free-fall is constant, therefore the graph is linear. I did an approximation with excel ('Trend-line') and gave it the the most default values.
The weird problem is, that although the axis has right values and ratios, and the approximated line LOOKS okay, the EQUATION written is horribly inaccurate. Look for yourself:
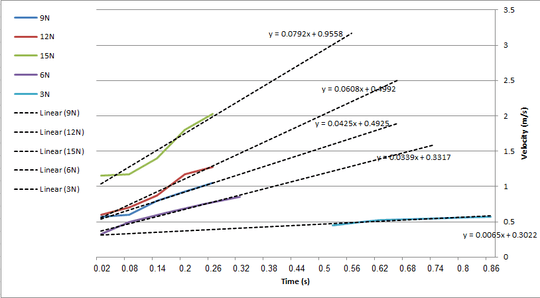
For example, for the top line, the equation is y = 0.0792x + 0.9558
But if you look at the graph and do the calculation (y2-y1)/(x2-x1) you will get about (3-1)/(0.5-0)=4.
I am not an excel expert, I'm just trying to do some physics works for school; can anyone please explain this odd behavior and how to fix this? Thanks!

Mark Segal
Posted 2012-05-12T20:08:00.447
Reputation: 75
