3
1
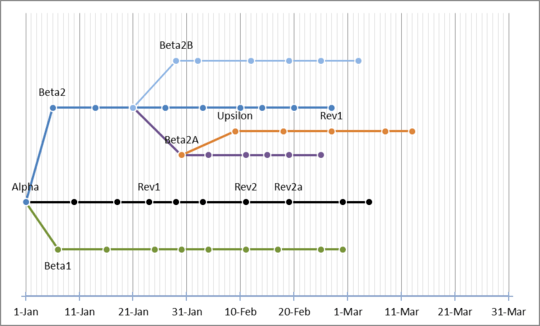
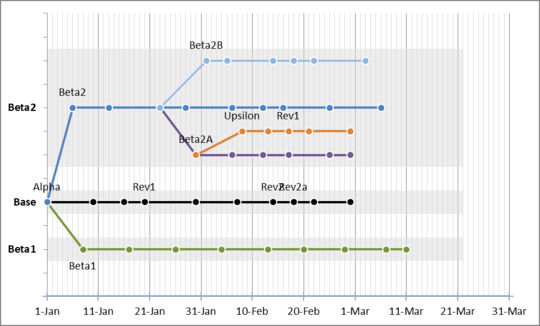
I would like to create a chart for my source control depicting the trunk and all the branches, with various details, like creation date, merge date, created revision, merge revision, close revision etc.
I want it to look like this:

I have looked into an appliation called SmartDraw, but unable to the required kind of output from it.
It would be awesome if the data can be generated by reading an Excel file input.
It would be required that the software runs on Windows XP SP3.

justshams
Posted 2012-04-17T06:17:30.220
Reputation: 129

what source control do you use? – Toby Allen – 2012-04-17T06:34:29.423
SVN, with Subclipse plugin in Eclipse, but the structure of my repository is messed up and i cant change that, so i need to create this diagram from the data form an excel, so I cant use the 'Revision Graph' functionality from SVN – justshams – 2012-04-17T06:51:21.910