0
I have a table of values like this one :
18
18
18
46
46
46
46
46
57
57
57
57
57
57
69
69
69
69
69
69
64
64
64
64
64
64
56
56
56
48
48
48
44
or if you prefer :
18
0
0
46
0
0
0
0
57
0
0
0
0
0
69
0
0
0
0
0
64
0
0
0
0
0
56
0
0
48
0
0
44
They come from a table in which, for each day there is a value, and for some days there are not (in which case I can take 0 or the previous value for convenience).
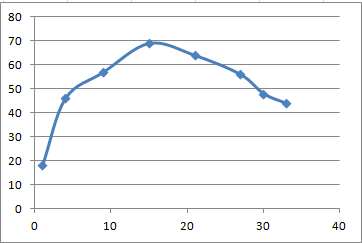
What I would like is to display the evolution of the number with a curve. But for days where there are no values, the curves "goes down", even (of course) if I hard put 0 in the cell, and if I use the previous value, then the curve looks good but with (of course) unwanted plane steps.
What formula could I write into each cell to make it use the actual value if there is one, or to estimate the projected value for the day to achieve getting a smooth and continuous curve ?

Yes, I cpuld do like this, but I would have to write another table. At this time, I just put an x on the lines I want to have their values on the graph, that fills a cell, letting the others empty. And the source takes of course all the column, including empty cells. – Oliver – 2012-02-27T16:16:36.147