Excel - stacked bar charts with two pairs of 'overlaps'

4

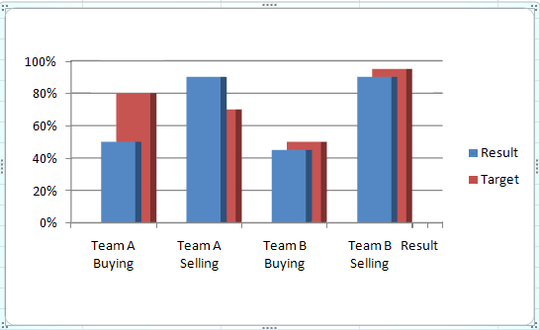
I'm trying to do some 'stacked' bar charts in Excel 2010 - here's a close psuedo example.

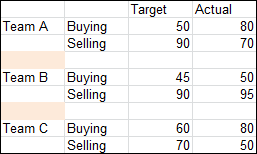
Team    Buying target   Buying result   Selling target  Selling result
Team A  80%     50%     70%     90%
Team B  50%     45%     95%     90%

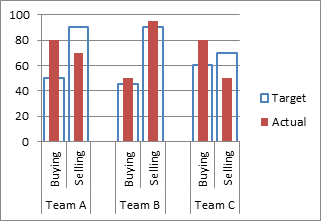
I want something like this:

enter image description here

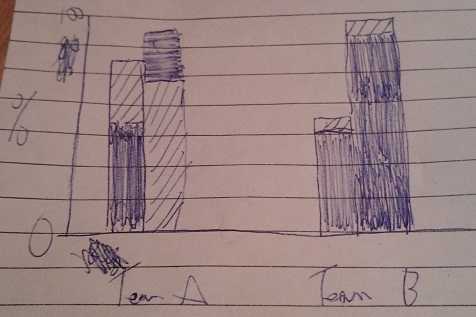
The buying and selling are side by side (left and right) grouped by team, and the target/results are overlayed (with whatever the smaller is in the foreground, or at least side by side). The targets are striped and results are solid (excuse my drawing).

Any tips? I've tried a hack to get it to work with 3D stacked, but can't get the two series right... This is something I'll be using on a weekly basis with over 20 'teams' so it can't be too much of a manual hack!

Chris

Posted 2011-12-14T22:06:01.480

Reputation: 538

1

Seeing your drawing this might help you! http://peltiertech.com/WordPress/clustered-stacked-column-bar-charts/

– None – 2011-12-23T02:41:54.657

Answers

11

Here is one way that might work for you.

Set up the data like this:

data

Make a column chart:

enter image description here

Format the 'Actual' series, and put it on the secondary axis:

enter image description here

Format the 'Target' series. give it no fill and a medium thickness border, and change the gap width to something like 25%:

enter image description here

Jon Peltier

Posted 2011-12-14T22:06:01.480

Reputation: 3 470

4

Stacked charts will not work. Since stacking is adding, you get 80% + 50% = a 130% total bar.

Here's my take:

1) Separate your selling and buying in separate entities, like this:

              Result    Target
Team A Buying   50% 80%
Team A Selling  90% 70%
Team B Buying   45% 50%
Team B Selling  90% 95%

2) Create a "3D Column" chart, the 3D vertical bar where the bars are one in front of the other. This should have your Target bars "behind" the result bars, which I think is ideal in your context.

3) Here are my settings recommendations for a quick clean, effective result:

  • Right-click chart, 3D-Rotation
  • Set X to 10 degrees
  • Set Y to 0 degrees
  • Set Perspective to 0 degrees.
  • In the Layout Menu under Chart Tools, Axes, and set Depth Axis to None (I forgot to do that in my screenshot, which shows a "result" item and tick lines next to Team B Selling. We don't have values for how deep the bars are, so we don't need this axis)

You should have 4 pair of bars, each one showing the result in front, and the target behind. The 3D allows you to keep it visible even targets are not met.

Screenshot

mtone

Posted 2011-12-14T22:06:01.480

Reputation: 11 230

This is really close to what I want, thanks! However as I'll have nearer 20 "teams", it's important for me to group buying/selling closer together and have 4 different colours (I'm using a striped pattern for the targets, blue for 'buying', and red for 'selling'). Is there any way I could achieve this? – Chris – 2011-12-19T15:35:51.700

@Chris Unfortunately, that's the closest I was able to achieve, sorry! My knowledge of charts is limited, so I'm not saying it's impossible. Here you can change the colors manually, and it could potentially be automated with a VBA macro. As for the spacing, you can change it but all bars needs to have the same spacing. – mtone – 2011-12-19T21:05:56.697

@Chris I don't know how to do the columns but I know how to do the striped fill. Once you have made your graph, format one of the data series, click fill, select pattern, and choose whatever pattern you choose. Hope that helps. – None – 2013-03-16T05:47:36.450