What's a simple way to do sensitivity analysis in Excel?

3

I have an Excel model of medium complexity that I'm trying to do some sensitivity analysis on. The ideal would be to have, for each of a set of inputs, run over a range of possible values and store the resulting output values (so maybe changing one input value at a time, but at the next level would be nice to change multiple ones at once).

I know there are plugins for this - solver.net seems pretty sweet - but I rebel at spending $1000 for what is a conceptually simple issue. For now I am following the manual algorithm of change-the-value, see-the-new-value, copy-paste, repeat. Which sucks.

Do folks have recommended tips/techniques/macros for how to automate this process?

YGA

Posted 2011-10-27T17:05:06.023

Reputation: 1 489

Are you using Excel's Solver add-in? – Mehper C. Palavuzlar – 2011-10-27T17:17:19.673

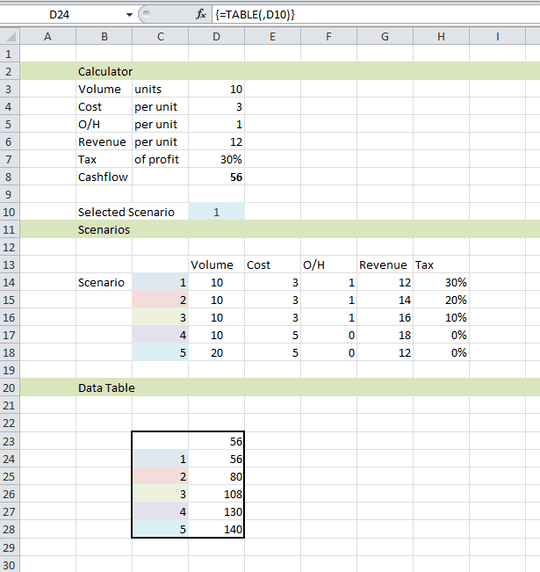
Not a tip for automation, but in the past I've found Excel's What-If Analysis feature very useful for this kind of analysis. http://office.microsoft.com/en-us/excel-help/introduction-to-what-if-analysis-HA010243164.aspx

– Excellll – 2011-10-27T17:34:14.207

Answers

0

I've found that Oracle's Crystal Ball, while not cheap, does exactly what I want.

YGA

Posted 2011-10-27T17:05:06.023

Reputation: 1 489

3

Solver (and Goalseek) is for optimising a situation where variables need to be flexed to produce a given constraint (ie maximise value, minimise cost, solve for a particular number).

Your problem is a more straightfoward sensitivity analysis.

Data Tables are a simple way to flex inputs through a model for simultaneous outputs, 1 way (1 changing variable) and 2 way tables (flexing a table of paired row and column inputs) can be added easily.

  1. http://www.homeandlearn.co.uk/excel2007/excel2007s7p1.html
  2. http://support.microsoft.com/kb/282851
  3. http://office.microsoft.com/en-au/excel-help/calculate-multiple-results-by-using-a-data-table-HP010072656.aspx

This will probably suffice for you.

More advanced data tables with 3 or more inputs

If you want to run scenarios changing 3 or more variables, then you can workaround the 2 way table limit by defining cases 1-10 in the data table, where a selection of 1 may drive a certain combination for variables A,B, C & D, a selection of 2 drives a different combination etc.

The picture below does this. The cell in D10 picks the variables from D14:18 to run through the calculator in D3:D8.

The basic calculator is Cash = Volume * (Revenue-Cost-O/H)-(1* Tax Rate).

The Data Table in C23:D28 shows the output from the 5 scenarios simultaneously (ie 56 for scenario 1, 80 for scenario 2 etc).

enter image description here

brettdj

Posted 2011-10-27T17:05:06.023

Reputation: 1 912

2

I have programmed a little Excel Add-In macro, which allows you to put sensitivity analysis on one, two, three, and up to twenty input cells in your spreadsheet and at the same time observe one or multiple output cells for their reaction on the input variations. You can either chose to have those input cells varied one at a time ("single Sensitivity") or in all combinations of the varied inputs ("multiple Sensitivity"). The add-in is free for commercial or private use and can be found at: http://www.life-cycle-costing.de/sensitivity_analysis/

I hope this little tool does exactly what you had been asking for and is freeware.

Would be nice to hear, whether this is what you have been searching for.

Thomas

Posted 2011-10-27T17:05:06.023

Reputation: 21

1

There's a couple of ways you can do sensitivity analysis on Excel. You can use data tables or the scenario manager. It depends on the number of variables you want to change in the analysis and what sort of output you'd like. Check out the following posts to learn more about both the methods.

http://awaisa.wordpress.com/2013/07/04/conducing-sensitivity-analysis-using-scenario-manager/

http://awaisa.wordpress.com/2013/06/20/sensitivity-analysis-with-data-tables/

Hope this helps.

Uberkoen

Posted 2011-10-27T17:05:06.023

Reputation: 11