1
I have an Excel spreadsheet that is defined the same way as in this question.
01/10/2010 0.99
02/10/2010 1.49
02/10/2010 0.99
02/10/2010 0.99
02/10/2010 0.99
03/10/2010 1.49
03/10/2010 1.49
03/10/2010 0.99
It is a sales record, and I have several sales every day.
What I need is to display a graph where each series would be one month. I would like the curve to represent the cumulative sum of sales during said month.
I would hence be able to compare the current month to previous months, and see when I am doing best in sales.
The graph would have over the X axis numbers from 1 to 31, the Y axis would be the cumulative amount of the sales, starting at the beginning of the month.
It would look like that:
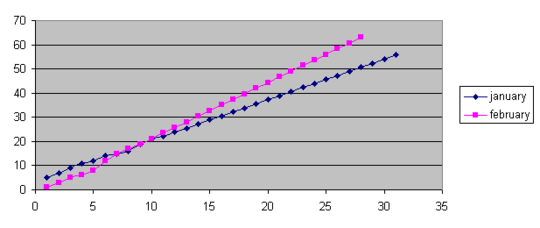
Is it possible, and if so, how?

Benoit Duffez
Posted 2011-07-15T12:31:48.920
Reputation: 474