2
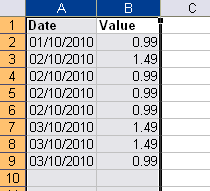
I have Excel 2003. My data is like this:
01/10/2010 0.99
02/10/2010 1.49
02/10/2010 0.99
02/10/2010 0.99
02/10/2010 0.99
03/10/2010 1.49
03/10/2010 1.49
03/10/2010 0.99
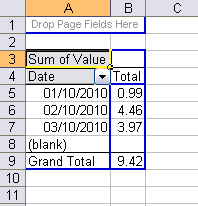
etc. In fact it is a list of sales every day. I want to have something like this:
01/10/2010 0.99
02/10/2010 4.46
03/10/2010 3.97
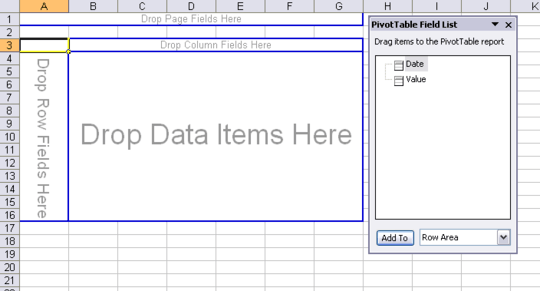
I want to group by date, and sum the column B. I'd like to see the evolution of the sales over time, and display a nice graph about that.
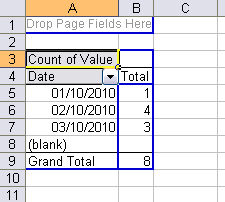
I have managed to create pivot tables that almost do the job: they list the number of 0.99 and 1.49 each day, but I can't find a way to simply sum everything and group by date.
Thanks for reading.

Benoit Duffez
Posted 2011-01-12T13:45:13.477
Reputation: 474

This is exactly what I wanted, thank you so much for this very detailed answer. – Benoit Duffez – 2011-01-12T14:34:01.767