3
2
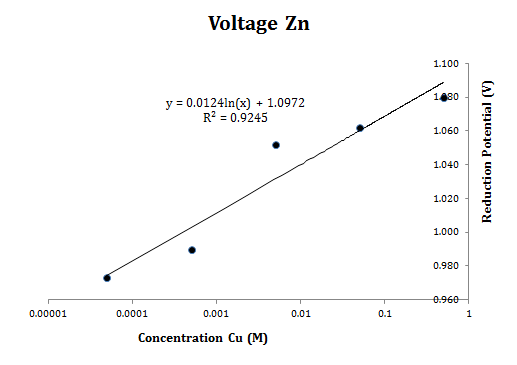
I have a dataset with logarithmic x-values (of concentration being diluted by a factor of 10) and regular (non-logarithmic) y-values. When I format the x-axis to use a logarithmic scale, the y-axis is displayed on the right side of the graph instead of the left side of the graph like it is supposed to be. What causes this, and is there any way I can put the y-axis back in its proper position?

nhinkle
Posted 2011-04-11T06:47:11.297
Reputation: 35 057


1This does seem to succeed in getting the axis back where I want it; thanks for that, but I would prefer to still have the axis labels be in this order if possible. Do you know of any way to get the axis back on the left side without changing the order? – nhinkle – 2011-04-11T07:12:14.690
@nhinkle: Yes, reversing the series doesn't fully solve the problem. I have edited my solution. – Mike Fitzpatrick – 2011-04-11T08:25:33.580