5
1
Suppose I have a spread sheet that looks something like this...
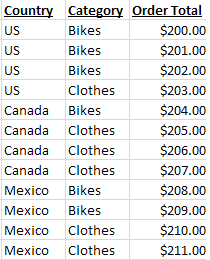
Now, I'd like to create a column chart that has 3 series, one for each country. Then, I want series for each category, but I want to plot the total, not each individual order total. So, something like this (excuse the horrible artwork)...
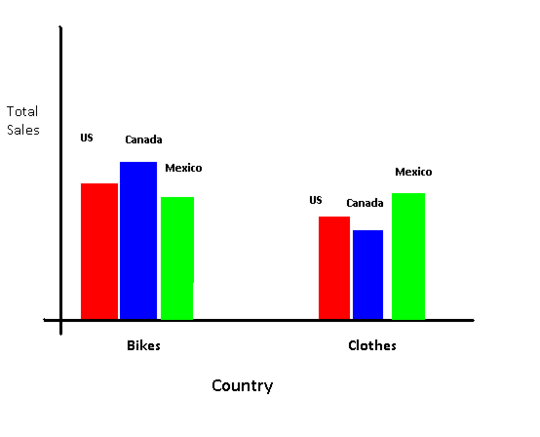
The data label placement isn't all the important, the key is that for each Category (Bikes and Clothes) I chart the total for each country, not individual values from the "Order Total" column.
Is this possible? Is it possible to do the same idea, but to switch Country and Category around?

Chaulky
Posted 2011-01-05T23:01:05.157
Reputation: 727


// , Thanks for the question! I'm still learning the use cases for Pivot Tables, so I think it's relevant to the tags you used. Maybe consider adding the tag "pivot-tables"? – Nathan Basanese – 2016-02-08T22:50:13.747