1
So I have been having this problem for over a year, if anyone can help me solve this I would be forever grateful. Seriously.
Upon using my laptop (8Gb of physical memory) for a long time eventually it stops working because it runs out of memory and I get all sorts of memory related errors. This is without turning it off by the way. The Percentage used according to task manager has never changed and that has always confused me, however studying virtual memory recently, I realised I have a total of 32Gb by looking at "Commited" Memory. I am having this memory issue now as we speak and have closed everything to type this. I have a commited memory usage of 30.2/31.9Gb which if I am correct is how much space the processes have "reserved" to be able to run.
Upon opening resource monitor and looking at the Commit (KB) column and summing up all the values there, it comes up to around only 6Gb so I cannot work out what the offendor is. Is there some application with some memory leak or something? I have no idea what is going on. I will post some screenshots below and feel free to ask for any cause I am not sure where to start.
Memory usage task manager:

Resource manager sorted by commit:

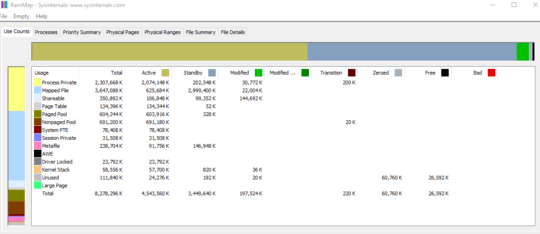
So I have downloaded RamMap and these are the values I am getting. None of this seems to add up to the 30Gb however, what should I be looking for?


See in Task Manager the column "Memory (Private working set)" (link).
– harrymc – 2019-11-22T08:16:41.980He’s not really running out of physical memory though, so the working set isn’t all that relevant. Maybe try RAMMap.
– Daniel B – 2019-11-22T08:45:07.027@DanielB I have appended the RamMap results to my post, although I'm not sure really what is is telling me and it doesn't seem like anything is using anything close to 30Gb – NightShade – 2019-11-22T10:04:44.267
@harrymc as Daniel has pointed out physical isn't really the problem here. I can use the same applications for days and the commited memory will still go up while the physical stays constant. (Infact physical is at 60% right now) – NightShade – 2019-11-22T10:05:59.897
It would still be useful to add "Memory (Private working set)" to the Task manager screenshot. – harrymc – 2019-11-22T10:16:24.453
Ah, sorry. It appears RAMMap is not useful for problems related to virtual memory overuse. I guess I remembered wrong. Another solution is to just close programs and see if the usage goes down substantially. – Daniel B – 2019-11-22T10:24:31.310
@harrymc I do not have the option for this column. What I included in my screenshot was every column option available I had. Is there something I need to do to find it? – NightShade – 2019-11-22T10:35:56.647
@DanielB with everything closed I am still getting a memory commited of 29Gb (way more than it should be tbh). Be really useful to know what is causing this – NightShade – 2019-11-22T10:37:14.877
Use Task Manager with the Details tab, rather than Resource Manager. Right-click any header to get the "Select columns" option. – harrymc – 2019-11-22T10:46:28.083
@harrymc appended it, although certainly not adding anywhere near 30Gb too – NightShade – 2019-11-22T10:51:15.303
@NightShade Launch Performance Monitor. Add the following counters: 1.Memory-->Pool Nonpaged Bytes 2.Memory-->Pool Paged Bytes 3.Paging File-->% Usage 4.Process-->Private Bytes 5.Process-->Virtual Bytes 6. Process-->Page File Bytes. Run Data collector set for few hours and see will collected info be of any use to You - more details here
– Leshy – 2019-11-22T10:54:06.750Thankyou @Leshy i'll try this overrnight and let you know how it goes – NightShade – 2019-11-22T10:55:05.960
The column "Memory (Private working set)" didn't help much. Could you replace it with the three columns of "Commit size", "Paged pool" and "NP pool"? – harrymc – 2019-11-22T11:23:06.530
@harrymc the commit size is the exact same as the Resource manager and the paged pool goes up to a maximum of 4Mb – NightShade – 2019-11-22T11:26:38.380
For analyzing the problem, follow this answer. It uses
– harrymc – 2019-11-22T13:53:28.180poolmonwhich is part of the Windows WDK, but to avoid this heavy download+install use instead PoolMonX.