0
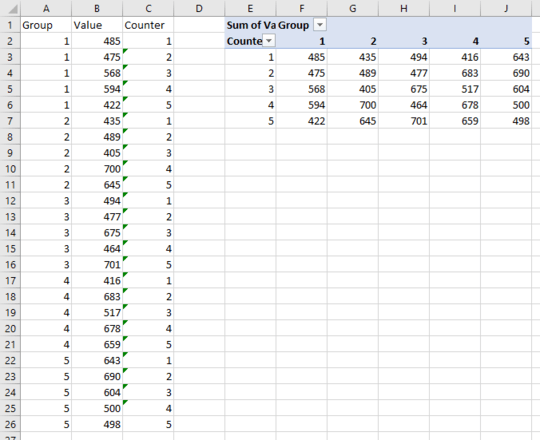
Is there a way to convert a dataset that looks like this Vertical Dataset
to a horizontal dataset with vertical lists like this Horizontal Dataset
Note: the first column is turned into the header, and lists are created based on the header.
Thank you!

1Yes. What have you tried so far, and where did you get hung up with those approaches? – Alex M – 2019-10-15T00:11:51.430
I have tried to transpose the chart, but this turns every cell in "Group" into it's own column header, rather than having one column for each Group and listing the Percent entries that correspond to it. I have found no other solution. – Kyle S – 2019-10-15T15:40:31.560
I wrote an answer to a similar question not long ago.
– Alex M – 2019-10-15T17:05:03.917OFFSETis just one approach, but it'll definitely work for you here. See if this gets you started: https://superuser.com/questions/1424891/stack-every-nth-column-under-neath-each-other there are also lots of other answers to extremely similar questions in the 'Related' list on that question. It's generally best to do some research before posting a Q.