2
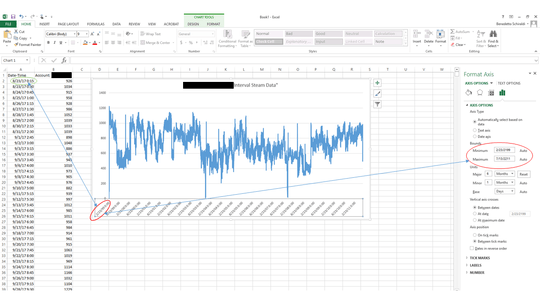
I am trying to plot a line chart in Excel , the x-axis is changing the year value significantly and I cannot figure out why.
It is taking my data from 2017 and adding over 100 years to it. For the life of my I cannot figure out why.
This is data I manually type in as time M/DD/YY 13:00, the same thing happens when I format the data to year. I am very good with Excel and VBA editor, but this one I cannot figure out.

Is it your intention to add all the values for the same dates? Or plot all rows seperately? if the latter, just switch the setting to
Text Axis– JvdV – 2019-08-22T11:47:03.143If you can post the source file about this problem, it will be more helpful. – Lee – 2019-08-23T09:33:22.753
I don't know why the dates are 100+ years off. Are the Y values plotted in the proper sequence? Also, do you realize that Excel ignores the time part of the date-time in a line chart? It would be helpful to see the data and chart, though we all understand confidentiality. – Jon Peltier – 2019-09-08T03:21:26.777