Compare a cell to a list of other values. Higher or lower

0

1

I have a list of test results in the cells of a column I would like to find a way to show how A1 compares to all of the other cells. In other words, the result of a test in A1 is higher than 75% of the other other results. Can someone help with the formula?
jason

Posted 2018-03-12T20:11:02.967

Reputation: 9

I've figured out how to compare the cells using the MIN feature. I now have a column that shows the comparison and I've gone thru and made the cells green where A1 is a higher result. Now if I could just figure out how to find the percentage of green cells I think I would have the results Im looking for – jason – 2018-03-12T20:36:48.790

please post some sample data with desired results, that would help us to better understand your problem. Also please don't add new information in comments, but edit your question. – Máté Juhász – 2018-03-12T21:07:18.640

Answers

1

Consider:

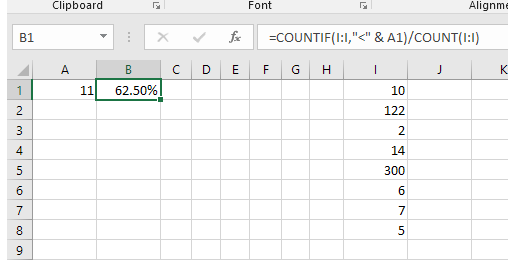
=COUNTIF(I:I,"<" & A1)/COUNT(I:I)

With a % format applied. We count the total number of items less than A1 in column I and divide by the total number of items in column I:

enter image description here

In the example above, the value in A1 (11) is larger than 5 of the 8 items in column I.

Gary's Student

Posted 2018-03-12T20:11:02.967

Reputation: 15 540

1

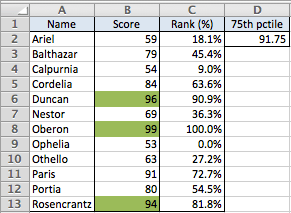
Excel has a PERCENTILE() function and also a PERCENTRANK() function. The 75th percentile is calculated in D2 of the table below with this formula:

=PERCENTILE(B2:B13,0.75)

And percent ranks can be calculated in Column C with:

=PERCENTRANK(B$2:B$13,B2)

Finally, you can use a Conditional Formatting rule like this one to highlight those scores that are greater than 75% of all the scores:

=$B2>PERCENTILE($B$2:$B$13,0.75)

enter image description here

Bandersnatch

Posted 2018-03-12T20:11:02.967

Reputation: 3 430

Names shamelessly stolen from @Gary'sStudent. :-) – Bandersnatch – 2018-03-12T22:08:09.977

0

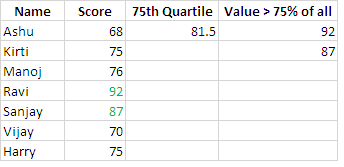
With a different approach, this formula will extract all values which are greater than 75% of all.

=IFERROR(INDEX($A$2:$B$8, SMALL(IF(($C$2<$B$2:$B$8), ROW($B$2:$B$2)-MIN(ROW($B$2:$B$2))+1, ""),ROWS($A$1:A1)), 2),"")

Cell C2 has 75 (the benchmark).

Edited Part:

enter image description here

In C2 write this formula.

=QUARTILE.INC(B2:B8,3)

Here 3 is for 75%

In D2

=IFERROR(INDEX($A$2:$B$8, SMALL(IF(($C$2<$B$2:$B$8), ROW($B$2:$B$2)-MIN(ROW($B$2:$B$2))+1, ""),ROWS($A$1:A1)), 2),"")

Rajesh S

Posted 2018-03-12T20:11:02.967

Reputation: 6 800

OP asked to show whether A1 is greater than 75 percent of all the other cells, not whether it's greater than the number 75. – Bandersnatch – 2018-03-13T15:22:21.580

You mean to say OP needs formula to find how may test results are higher than 75 Percentile of of A1? If yes, in this case I need to count 75 Percentile of data range in C2 and find the higher values as you did. In that case also my formula will work :-) – Rajesh S – 2018-03-14T04:44:51.023

My data range is B2:B7 & values are 68,75,76,92,87,70 and 75 percentile of the range in C2 is 84.25 (as you calculated), then I applies the same formula as you did to highlight values, the values I got are 92 & 87. And then I tried the same, my formula also extracts 92 & 87. My mistake was that in my answer I should have write "Cell C2 has 75 Percentile of the data range the benchmark". – Rajesh S – 2018-03-14T04:46:20.653

Good, then edit your answer and make it correct. It is incorrect now. Include an explanation of how to calculate the 75th percentile. – Bandersnatch – 2018-03-14T06:14:53.283