3
I'm attempting to make a 4 quadrant bubble chart in Excel to compare some competitor companies. I've input all my data from a pivot table, with 4 slicers to filter what the bubble chart is showing you.
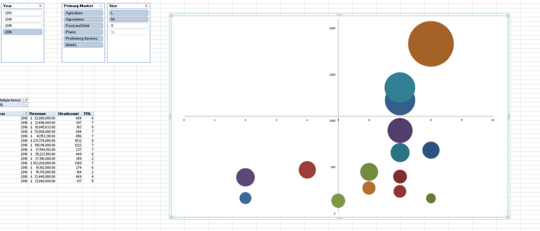
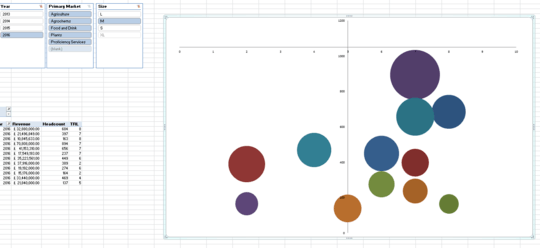
I have set the max value on the y-axis to 2100, with the x-axis crossing it at its midpoint. Unfortunately, when I change the filters, the y-axis needs to change as well, but I'm unsure how to get my y axis crossing point to change to the midpoint of the new value.
Any help would be greatly appreciated.

user402253
Posted 2018-02-15T10:54:22.323
Reputation: 31
1You probably can't do this with built-in axis, but could create an "artificial axis" made from calculated points that adjust with your sliced data. – dav – 2018-02-15T13:26:22.060
Is there any value more than 2100 you have set for the Scale ? – Rajesh S – 2018-02-16T11:26:18.697
No, 2100 is my max value – user402253 – 2018-02-20T11:03:39.413