1
1
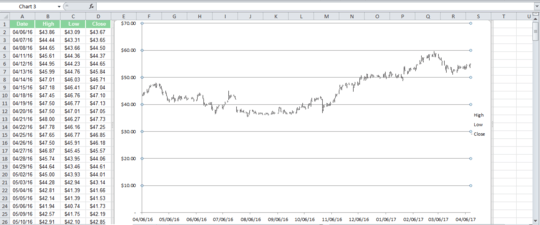
I hope I can get some help with the problem that I'm trying to solve. I want to be able to chart some stock data using excel. I have that part done. I have 3 columns (date, high, low, close). I am currently able to view that data using excels stock chart in the chart options selection area.
I have a large number of data points but I want to be able to select specific ones from the chart when I click on the data point on the chart. I would like to be able to click on N number of high points and draw the trend line on the graph using those points only.
I would then like to do the same thing for the low points and draw the trend line on the same graph using only the points I selected out of many. Below is an image of what I have so far.
I would like to be able to blow the chart up so I can really see the points once this is done. Maybe have an event like shift and left click for high points and shift right click for low points. I'm not sure if that's possible, but just some way to select all my high points and low points that I want to use to draw a trend line for each (high, low).

user3399732
Posted 2017-04-15T01:09:12.150
Reputation: 11
FWIW, I think you have two questions here. One about trending for a subset of points and the other about zooming in on the chart. It may be worth editing this question into the two separate ones. – dav – 2017-04-17T12:46:18.250