Switching axis in Excel

1

enter image description here

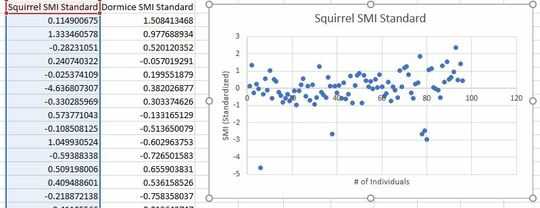
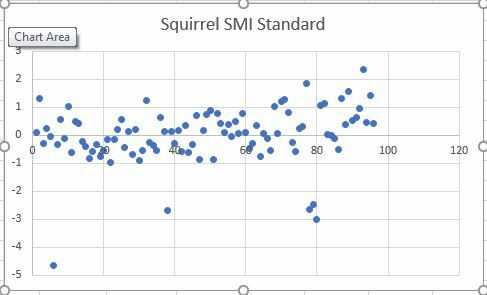
I'm trying to switch the axes on this graph, so that SMI is on the x axis and number is on the y. That's what a lecturer told me to do anyway. If that's right, how do I do it? If not, why should I keep it like that?

the data goes down to about cell 98

Graph and a bit of the data I used

Nyssa Jacobsen

Posted 2017-02-09T12:10:59.990

Reputation: 11

Show some Data, SMI and corresponding numbers – yass – 2017-02-09T12:34:12.537

" If thats right, how do I do it? If not, why should I keep it like that?" - whether it's right or not is off-topic here. What you've tried to change axes? It should be simple: right click on chart, select data, switch... – Máté Juhász – 2017-02-09T12:55:05.813

If a professor asked you to do this, I'm assuming it means they've taught this subject to you previously. Is this a homework question? – music2myear – 2017-02-14T23:04:15.230

Answers

1

When you chart data in Excel, each series in a chart has a SERIES formula. Click on the series and look in the formula bar. The formula looks like this:

=SERIES(Sheet1!$C$2,Sheet1!$B$3:$B$102,Sheet1!$C$3:$C$102,1)

The syntax is

=SERIES([name],[x values],[y values],[plot order])

You can edit this formula right in the formula bar. Simply copy and paste to put the X and Y addresses in the order you need (note that B and C are switched):

=SERIES(Sheet1!$C$2,Sheet1!$C$3:$C$102,Sheet1!$B$3:$B$102,1)

Jon Peltier

Posted 2017-02-09T12:10:59.990

Reputation: 3 470

0

Copy the data, under paste options click transpose. Accidentally worked this out after trying for ages. Hope this helps someone out!

Gorks

Posted 2017-02-09T12:10:59.990

Reputation: 1