Excel Structured Breakdown

2

I have a set of data in this form:

Raw data

I want to give a breakdown so one could collapse the data per product and portfolio and only inspect the detail on the rows you're interested in.

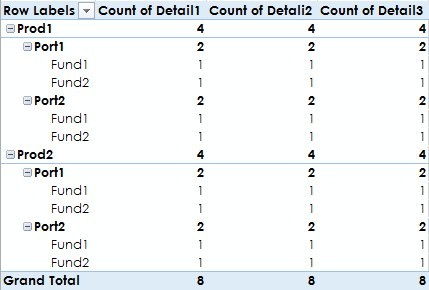
Something like this:

Pivot table

Except that a pivot table always summarises its data. So I get a bunch of 1's in every column per fund, instead of the actual data I'm interested in.

I tried to use the outline/grouping functionality instead, but I can't figure out why on earth I would ever be interested in this outcome:

enter image description here

That is simply not a useful thing to do with my data. Not only is it not customizable, but clicking the little blocks in the margin simply hides or shows all the data. Whatever.

So is there a way that I can group my data like the pivot table does, without aggregating the rows containing my detail?

Cobus Kruger

Posted 2016-11-29T14:39:45.487

Reputation: 123

Answers

2

You could try using a pivot table and placing everything under the Rows section.

Then head over to the Design tab for the pivot table and ask for the data to be shown in tabular format.

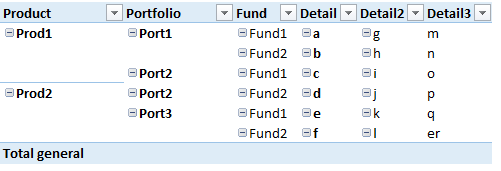
You'd get more than you bargained for because you would have everything be collapsible, but the result would look something like this:

Answer to Question

Dan Contreras

Posted 2016-11-29T14:39:45.487

Reputation: 51

Okay, I'm happy with this. Strange that it isn't more directly supported though. – Cobus Kruger – 2016-11-30T07:10:31.267

0

Outline/grouping is indeed the tool you want, but it doesn't do it automatically. Instead, you would highlight the range you want grouped together, then go to Data | Outline | Group. That allows you to select a subset of cells which can be collapsed or shown. It does, however, also require blank rows between segments.

Honestly, what you're looking for sounds exactly like the function of Filtering, which you already have active on your page. Is there some reason that filtering isn't working for you?

Werrf

Posted 2016-11-29T14:39:45.487

Reputation: 769

Sorting, filtering and the pivot table all allows one to specify a list of columns to use, but grouping doesn't? That's a strange design choice. The grouping is only useful when the data is too much to group it manually. – Cobus Kruger – 2016-11-30T06:49:32.760

Filtering works, but it doesn't have the same "browsability". Also, this kind of breakdown is really common in many tools that don't even come close to Excel's analysis capabilities, so it's strange that it doesn't exist. – Cobus Kruger – 2016-11-30T06:51:34.760