2
1
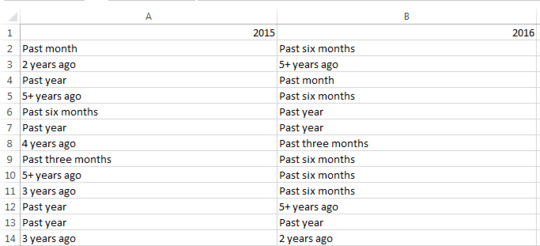
I'm trying to create a pivotchart which will compare 2 sets of data in Excel. I've tried googling but everything I find either seems to require options to be checked that are greyed out for me, or far more complicated than what I'm trying to do. My data is simple and looks like this:
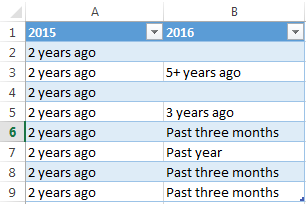
When I insert pivotchart and drag in 2015 + 2016 into the values area, I'm given the correct values for 2015 however for 2016 it's counting anything in the same row:
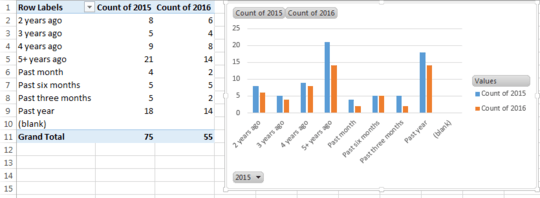
As you can see here, 2015 is correctly counting 8 counts of "2 years ago" however it's reporting 6 for 2016 and just counting anything that is within the same row with the right value at 2015.
I'm aiming to have a simple bar graph, where I want to display the total count of all the options in each column against each other (1 bar for each option for both 2015 and 2016).
This is how it's looking, which is fine except that all the values in the 2016 column are wrong, since it's counting them incorrectly as I explained above. Anyone got any ideas what I'm doing wrong? Totally new to this.


Annoying but worked, I assume there is some reason the data has to be in the other format that I'm too inexperienced to understand – Matadeleo – 2016-05-11T16:09:11.237
if you use pivot table, the data source has to be in a "tabular form" in order to use the maximum of the pivot functionality. Take time to learn this very powerful Excel feature... you will gain time for data analysis. Some background infos on the structure here
– visu-l – 2016-05-11T17:34:21.700