Filter wrong data out of pivot table in Excel

0

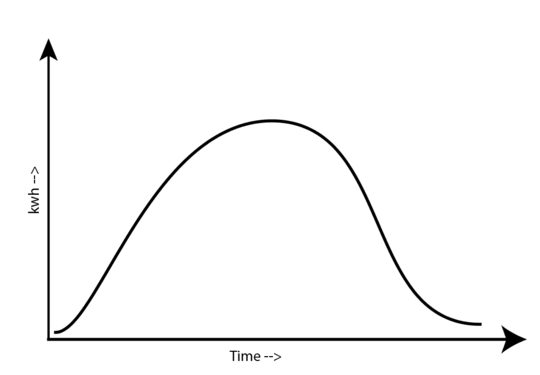
I've a lot of data I must analyse but some data is wrong. That gives a problem for draw my pivot charts and tables. If there were no errors the chart must look like this:

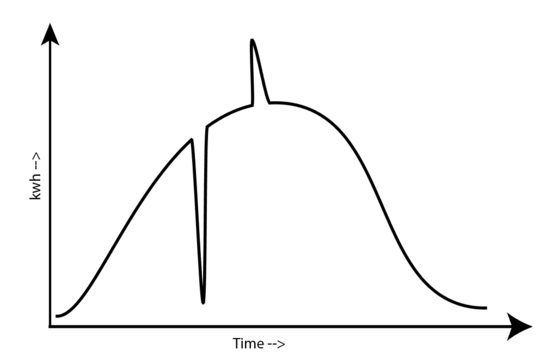
But it doesn't. Here is what I get:

Of course the wrong fields are more then only that. In total I have more than 300k rows correct or not. I've no idea how many percent is wrong.

Update one: The data I've get was taken every 5 minutes over a period of 5 years. Sometimes is it possible that there is no data on the 5th minute but on the 6th or 4th minute. Well that mistakes must be filtered.

Update two: Here is some fake data from my pivot table where you can see that the strike through lines are wrong:

╔═══════════╦════════╗
║   Time    ║   kWh  ║
╠═══════════╬════════╣
║ 07:40:15  ║ 32,65  ║
║ 07:45:25  ║ 40,83  ║
║ 07:46:05  ║ 0,00   ║
║ 07:50:57  ║ 50,38  ║
║ 07:55:14  ║ 55,71  ║
║ 07:56:20  ║ 0,00   ║
║ 08:00:14  ║ 60,72  ║
║ 08:05:25  ║ 61,42  ║
║ 08:10:54  ║ 70,78  ║
║ 08:15:10  ║ 80,75  ║
║ 08:16:01  ║ 0,00   ║
║ 08:20:25  ║ 85,06  ║
║ 08:25:02  ║ 85,46  ║
║ 08:30:10  ║ 100,73 ║
║ 08:35:25  ║ 100,21 ║
║ 08:37:10  ║ 0,00   ║
║ 08:40:47  ║ 115,60 ║
║ 08:45:45  ║ 120,16 ║
║ 08:50:01  ║ 128,77 ║
║ 08:55:25  ║ 140,75 ║
╚═══════════╩════════╝

Background information: the information goes about solar panels and the production in kilo watt hour of it per 5 minutes.

My questions are now:

  • How can I filter that wrong data explained above out of my pivot tables and pivot charts in Excel version 2013?
  • Can I calculate how many percent is wrong?
H. Pauwelyn

Posted 2015-12-19T10:48:57.227

Reputation: 638

2Without looking at least part of your data. Such as "wrong" data doesn't exist as filter, you need to understand your numbers and tell what criteria makes a number to be wrong. Please edit your question to add more information. If difficulty for you is finding the criteria, then statistics stackexchange is probably more appropriate for your question. – Máté Juhász – 2015-12-19T11:10:34.703

@MátéJuhász: I've updated my question – H. Pauwelyn – 2015-12-19T12:56:12.293

Answers

1

You need to insert a new column and there you can check whether the data is ok:

=MOD(MINUTE(A2),5)=0

This will give TRUE for correct data and FALSE for wrong. Just filter it in the pivot chart.

If you want to count wrong and correct data it's also easy in a pivot table.

Update

Filtering out wrong values

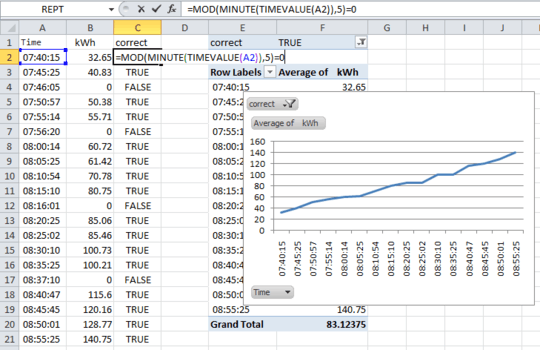
After inserting the new column, just insert a pivot chart on the data with the following settings:

  • report filter: "correct", set it to TRUE
  • axis fields: "time"
  • Values: Average of "kWh" (same result would be with sum too)
  • change chart type to "line chart"

enter image description here

Count wrong and correct values

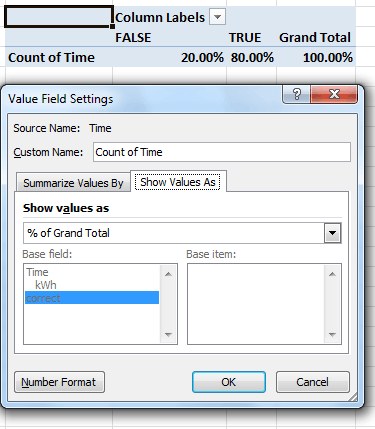
In a pivot table set:

  • column labels to "correct"
  • values to Count of "time" in "value field settings" - "show values as" select "% of grand total"

enter image description here

note

getting your data from the site it wasn't automatically recognized my excel as time, I had to use TIMEVALUE() function as in first screenshot; best approach however to convert already the original column to time if it's text

Máté Juhász

Posted 2015-12-19T10:48:57.227

Reputation: 16 807

Can you make some screenshots or something or an action plan how I can do it in my pivot table or my dig data table? I'm a noob whit pivot tables. – H. Pauwelyn – 2015-12-19T16:56:18.093

Please post some sample data and I show how work it. – Máté Juhász – 2015-12-19T17:04:44.637

Do you need the complet file, sir or madam? I'm sure that is impossible because the owners trust me to hold that information by myself. I'm just a student that must analyse that information... You must do it by the fake data that I've added to my question. – H. Pauwelyn – 2015-12-19T17:13:42.443

@Luïs please see the updated answer. – Máté Juhász – 2015-12-21T07:46:26.577