0

I read a lot but what I read so far did not make much sense, so I am asking here a new question about Java and memory.

So I am starting a Java app with the following CLI arguments

-Xms48m
-Xmx96m
-XX:MetaspaceSize=80m
-XX:MaxMetaspaceSize=150m

Within my app, I have some code like that to display the used memory:

Runtime runtime = Runtime.getRuntime();
//Used mem: runtime.totalMemory() - runtime.freeMemory()
//Total mem: runtime.totalMemory()
//Max mem: runtime.maxMemory()

The results are as expected:

Used Memory: 43 mb
Free Memory: 16 mb
Total Memory: 60 mb
Max Memory: 96 mb

I also had the Garbage Collector run, made a heap dump and analysed it, and it also says, that around 43MB are used.

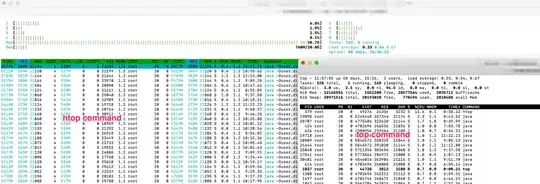
So this part is fine so far. But now, if I run the htop command on Linux, I get these numbers for my Java app:

RES: 409M
DATA: 611M

First question:

  1. How come, that these numbers are so high?
  2. If I restart my app, it starts with RES: 224M, DATA: 339M and grows and grows until after a day it is at 409M/611M as mentioned above and then I restart the application with a cron job, otherwise my RAM would be gone. How can I prevent that?

(I have 80 instances of the same app running on a server with 32GB RAM).

Here is a screenshot of the situation: enter image description here
Platform:

  • OS: Ubuntu 16.04.6 LTS

  • Java: OpenJDK Runtime Environment (build 1.8.0_232-8u232-b09-0ubuntu1~16.04.1-b09) / OpenJDK 64-Bit Server VM (build 25.232-b09, mixed mode)

  • Java App: Play Framework v2.7 app
schube
  • 163
  • 2
  • 9

1 Answers1

1

In your analysis of the Java memory usage, you forgot the size of the memory used by DirectBuffer's. You can control it with -XX:MaxDirectMemorySize and it defaults to the maximum heap size.

In the worst case scenario, you allow Java to use 342 MiB of memory for its data and some other minor memory zones. You can find the description of all memory zones on Baeldung.

When you start analyzing the real memory consumption, you need to take into account also the size of Java's libraries, which is not huge, but jvm.so accounts for around 20 MiB. All this amounts to the RSS figures you cited.

However, if you want to check if your system can sustain so many JVM's, the intricacies of Linux memory come into play:

  1. RSS accounts for all pages resident in memory, whether they are used for private data of the JVM or cached parts of files and libraries. In a similar way as Java's GC works, the Linux kernel releases the file caches, when it runs shorts of physical memory. Moreover many pages can be shared between JVM's
  2. DATA measures all the private memory mmap-ed into the processes virtual space. Most of it will never have any underlying physical memory.

If you want to check each JVM's virtual memory in detail, use:

pmap -p <processes_pid> -x

or a sorted version on dirty pages:

pmap -p <processes_pid> -x | sort -rnk 4

and you can see what contributes to those RSS and DATA figures.

Edit: You can read more about how Linux classifies memory and the figures given by many tools on this site

Piotr P. Karwasz
  • 5,292
  • 2
  • 9
  • 20
  • Thank you so much! I think, this was the missing peace. I will read the linked info tonight in detail and try it next week and give feedback. But I think, this is the right track! Thank you and have a nice weekend! – schube Jan 05 '20 at 06:37