3

tl;dr: My scrape interval is 1m, yet I have a 15s resolution. Why?


My prometheus configuration includes a job to scrape kong metrics:

- job_name: kong_blue
  honor_timestamps: true
  scrape_interval: 1m
  scrape_timeout: 10s
  metrics_path: /metrics
  scheme: https
  dns_sd_configs:
  - names:
    - ...

Consequently, when on the targets tab in the HTML interface, we can see that kong is scraped roughly every minute, as expected.

However, when I query that data, for example kong_http_status, prometheus indicates a resolution of 14s. And indeed, the graph also shows one value "tick" every 15 seconds.

kong_http_status query in prometheus, showing a 14s resolution

Why is my resolution 15s?

aspyct
  • 340
  • 6
  • 19

2 Answers2

2

The resolution there is the resolution of the graph, which is automatically determined by the width of the graph and the time period it covers. It bears no relation to the scrape interval.

If you want to make it lower, either zoom out or set it manually in the res textbox.

brian-brazil
  • 3,904
  • 1
  • 20
  • 15
1

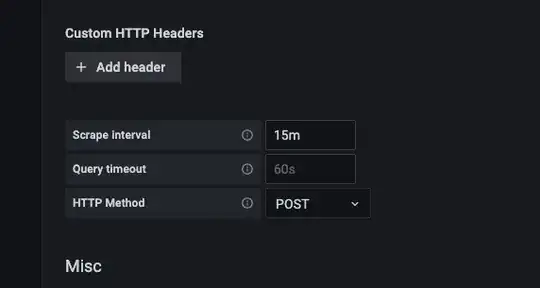
if you change it on Prometheus datasource. Prometheusdatasource

it will be auto-updated on Grafana Grafana

Paul
  • 2,755
  • 6
  • 24
  • 35
vpavesi
  • 11
  • 1