1

We are in this scenario: https://stackoverflow.com/questions/7304826/how-to-debug-a-multithreaded-hung-process-in-linux

When we try to look at a rogue process (which is consuming 100% CPU) then it's in this state:

ls -l /proc/XXXX/fd 
lrwx------ 1 root root 64 Feb  1 16:08 9 -> /tmp/.ZendSem.sdiU42 (deleted)

We'd like to know what was in the file (that is now deleted) in an attempt to try and track down what is causing the issue. I think that ftrace might be able to do this (or maybe another tool), but I don't know how to go about doing this.
enter image description here

enter image description here

Patrick Rynhart
  • 190
  • 1
  • 10
  • strace -e open and if you want to see the syscalls made buy the child process -f – c4f4t0r Feb 01 '19 at 07:06
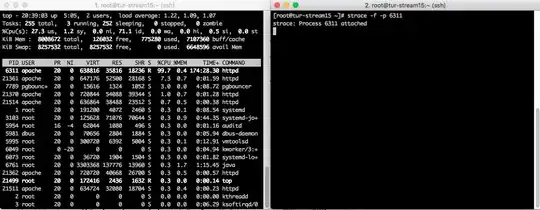
  • @c4f4t0r I've just added a picture illustrating the problem. The child process is consuming 100% CPU but it is making no system calls once it gets into a "hung state". (Even if I leave the terminal on the right open for 12 hours in a screen session and come back, there is no output whatsoever.). I don't know which httpd processes are going to end up in this state, so I can't attach strace beforehand. So I am trying to find out what was happening on the system leading up to this point. The problem is reproducible - i.e. I can wait and the problem will reoccur. – Patrick Rynhart Feb 01 '19 at 07:45
  • if your system has more then one cpu, your process is using one cpu, cat /proc//stack – c4f4t0r Feb 01 '19 at 07:48
  • Have just updated with screenshot as per above. Not quite sure what to make of that - doesn't look like much of a stack trace.... – Patrick Rynhart Feb 01 '19 at 07:54

1 Answers1

2

/tmp/.ZendSem.sdiU42 is a lock file that was intentionally deleted right after it was created. This is sufficient to prevent this lock from being taken out by other threads. It also has the nice property of going away once the process is gone. See the php sources, ext/opcache/zend_shared_alloc.c


You need to collect lot more context about what your application is doing, and how this interacts with the software stack and kernel.

Identify the PID in web server logs and see if you can identify anything, perhaps when the worker was forked.

Profile the execution. On Linux, run perf top and see where it the most time. Install debug symbols, for this program and the kernel, until you can make sense of the function names. Also, try ltrace if you want to something like strace but for user library calls.

John Mahowald
  • 30,009
  • 1
  • 17
  • 32
  • Thank you for the answer. In the end, we escalated to a third party as we were being quite badly impacted. The third party was able to determine our site was affected by this: https://tracker.moodle.org/browse/MDL-64609. But I will take on board the comments you have detailed - I would like to know how to go about troubleshooting something like this... – Patrick Rynhart Feb 04 '19 at 23:38
  • P.S. In general this doesn't look something that is easy to troubleshoot/debug/determine....... particularly if there are no syscalls going on (which was the symptom). Our non-production environments were not exhibiting the same issue - we didn't have the specific operations being undertaken by our users (which triggered this fault) in them..... Hmmm – Patrick Rynhart Feb 04 '19 at 23:40
  • I might have a go at what you've described for a very simple "hello world" app on a test VM - not even something served under httpd, but a simple C binary (e.g.). I get the idea of what you're describing and am keen to learn. – Patrick Rynhart Feb 04 '19 at 23:48
  • That this was a Moodle environment would be good to know in your question, feel free to edit that in. Include any user steps to reproduce if known. In general, Linux has strong observability tools. You can profile any user or system call and count them or generate flame graphs. You probably have most of the source code, so when you find a function call you can debug it. – John Mahowald Feb 05 '19 at 12:20