124

Is there a good command line utility to monitor hard disk load on linux? Something like top but then monitoring disk activity i.s.o. cpu usage.

More specifically, I suspect that for some (heavy load) servers after several optimizations on various parts of the program(s) that run on it, right now the bottleneck is simply the logging to files on the disk. But I find it very difficult to assess how much traffic the servers can handle.

My ideal tool would be something that prints "You're using 35% of your disk bandwidth right now". Any ideas?
peterh
  • 4,914
  • 13
  • 29
  • 44
Pieter
  • 1,369
  • 3
  • 11
  • 9
  • 2
    Perfect question, is exactly what I was looking for =) – rafa.ferreira Mar 02 '11 at 14:04
  • It's possible to read sysfs directly, like `/sys/block/sda/stat`. Field #1 gives the total # of reads, field #5 is the total # of writes, field #9 is the number of I/O operations in progress. See more in http://www.kernel.org/doc/Documentation/iostats.txt The values are unsigned long and may wrap. – sastanin Jan 22 '13 at 14:12
  • This is a very good question because we're always battling with this problem on Plesk servers. However, what is missing is `how do you do it with SNMP?`. It's fine to log in and check stuff, but one really needs historical data. – Eugene van der Merwe Mar 21 '14 at 09:05
  • http://unix.stackexchange.com/questions/55212/how-can-i-monitor-disk-io – Ciro Santilli OurBigBook.com May 18 '16 at 12:33

9 Answers9

101

You can get a pretty good measure of this using the iostat tool.

% iostat -dx /dev/sda 5

Device:         rrqm/s   wrqm/s     r/s     w/s   rsec/s   wsec/s avgrq-sz avgqu-sz   await  svctm  %util
sda               0.78    11.03    1.19    2.82    72.98   111.07    45.80     0.13   32.78   1.60   0.64

The disk utilisation is listed in the last column. This is defined as

Percentage of CPU time during which I/O requests were issued to the device (band-width utilization for the device). Device saturation occurs when this value is close to 100%.

Dave Cheney
  • 18,307
  • 7
  • 48
  • 56
  • 3
    In what package does this reside in Debian, if any? `apt-cache dump` didn't turn anything up for iostat – hBy2Py Jan 25 '15 at 01:15
  • 12
    @Brian: It's in the sysstat package (through yum anyway...) – Joe Apr 29 '15 at 22:01
  • Couldn't find this on RHEL 6.5. Is this available for RHEL? – Hazok Dec 10 '15 at 02:26
  • Can this work without having to continue with a delay? Trying to run a single instance to get data from gets the same number presumably as it can't take samples??? – Wilf Jul 03 '17 at 18:56
  • @Hazok It is part of the sysstat RPM on RHEL 6.5. – TheGeneral Jul 26 '17 at 16:26
  • It's important to read the man page for iostat about certain of these columns as they can report meaningless data for certain type of disk such as SSD and RAID arrays serving requests in parallel. %Util is wrong for example and can be at 100% or more... it's best to look at wait times but not the `svctm` column which is wrong, it's even written in the manual page that it will be removed in future versions... Unfortunately it seems that other commands such as atop are relying on the same unreliable stats to report disk busy time. So be careful not to end up chasing a non existent problem... – 2072 Feb 27 '21 at 23:30
89

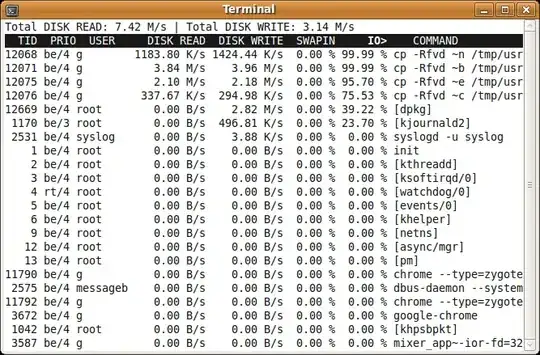
iotop is a version of top that looks at how much IO each process is using. It's in the standard ubuntu repositories; I don't know if it's in RHEL or Fedora, but it should be.

enter image description here

For older kernels (say CentOS 5.x or RHEL 5.x) that do not support iotop, use topio instead (documented here: http://yong321.freeshell.org/freeware/pio.html#linux. It relies on /proc//io for io statistics and provides similar functionality as iotop. See link for further details.

Tim Howland
  • 4,678
  • 2
  • 26
  • 21
19

As suggested by sastanin in comments, you can process directly values given in /sys/block/sda/stat or /proc/diskstats. This may be helpful when none of the other mentioned tools are available and you can't install them easily.

For instance (IIUC) something like this (in bash) should give the number of reads per second :

OLD=`awk '{print $1}' /sys/block/sda/stat` # First field is number of read I/Os processed
DT=1
for ii in `seq 1 10`
do
    sleep $DT
    NEW=`awk '{print $1}' /sys/block/sda/stat`
    echo $((($NEW-$OLD)/$DT))
    OLD=$NEW
done

See https://www.kernel.org/doc/Documentation/iostats.txt and https://www.kernel.org/doc/Documentation/block/stat.txt for documentation.

14

You should take a look at atop, which combines the power of iotop/top/iftop, all in one place, and highlights the critical parts on your system.

Yvan
  • 350
  • 3
  • 8
6

I would recommend taking a look at the nmon tool. It will show you live load on a number of system parameters as well as recording data to a file for later perusal. It's a free tool available here:

MikeyB
  • 38,725
  • 10
  • 102
  • 186
5

to find out what your total bandwidth is you might use hdparm -T /dev/sda to test the buffer cache (fileio) performance hdparm -t /dev/sda to test the device read performance

examples: my laptop gets 82MB/sec from the SATA disk and 2GB/sec from the cache. My dekstop gets 12GB/sec from the cache and 500MB/sec from the HW RAID array. I suspect those last numbers could be double on server class hardware.

set readahead higher than 256, 4096 works best for me

for i in 128 256 512 1024 2048 4096 8192 16384 32768  
do  
hdparm --setra $i  
  for j in 1 2 4 8 16 32  
  do  
  time dd if=/dev/sda of=/dev/null bs="$j"k  count=<fixthis> 1GB / blocksize  
  done  
done  

times reading 1GB at different block sizes and different read-aheads

raphink
  • 11,337
  • 6
  • 36
  • 47
user2987
  • 71
  • 2
  • Welcome to SF. You can use code highlighting in your posts by putting backquotes around strings or indenting paragraphs. – raphink Feb 22 '12 at 10:00
  • Two things - 1) `--setra` is now `-a`, and 2), the `hdparm -{T,t}` commands only issue disk reads, according to `strace`, so are nondestructive. (Standard disclaimer about advice on the Internet applies) – i336_ May 30 '16 at 10:29
4

The standard tool for showing hard disk load is iostat.

It won't tell you how much %age disk bandwidth you're using, since it doesn't know how much bandwidth your disk has. In any case, your disk only has the manufacturer's quoted figure for large transfers of contiguous data.

Alnitak
  • 20,901
  • 3
  • 48
  • 81
3

I think RRDtool should do what you want here it uses a daemon to dump system data and then allows you to process it however you like. I have often used it to produce graphs etc. to measure system load.

PixelSmack
  • 530
  • 4
  • 8
1

htop is a nice tool to check process information. You can add or remove columns and among them are read and write speeds of processes.

inquam
  • 169
  • 13