4

I am experiencing bizarre behavior on scaling a multiprocess/multithreaded C++ application. The application contains 10 separate processes, communicating through Unix Domain Sockets and each one having ~100 threads doing IO and several processes on that IO. The system is OLTP and transaction process time is critical. The IPC IO is based on boost serialization using zmq over unix domain sockets (it is fast enough on all benchmarks on our local server, two old xeons with 24 cores). Now, we do observer insanely low performance on systems with higher numer of cores!

1x Intel® Xeon® X5650 - virtual - 6 cores - TPS is ~150 (expected)
1x Intel® Xeon® E5-4669 v4 - dedicated - 32 cores - TPS is ~700 (expected)
2x Intel® Xeon® E5-2699 v4 - dedicated - 88 cores - TPS is ~90 (should have been ~2000)

Running several benchmarks on the 3rd server shows perfectly normal processor power. memory bandwidth and latency looks normal.

htop shows very high times on kernel (the red part). So our first guess was that some system calls takes too long time to accomplish, or we have done something wrong in multi-threaded code. (See the picture below) perf top reports a specific systemcall/kernel routine (native_queued_spin_lock_slowpath) to take about 40% of kernel time (See below Image) Which we have no idea what it does.

However yet another very strange observation is this:

lowering the count of cores assigned to processes, makes the system utilize cores better (more green parts, higher cpu usage) and makes the entire software (all 10 processes) run much faster (TPS is ~400).

So, when we run the processes with taskset -cp 0-8 service we reach ~400 TPS.

How can you explain why lowering number of assigned CPUs from 88 to 8 makes the system run 5 times faster, yet 1/4th of the expected performance on 88 cores?

Additional information:
OS: Debian 9.0 amd64
Kernel: 4.9.0
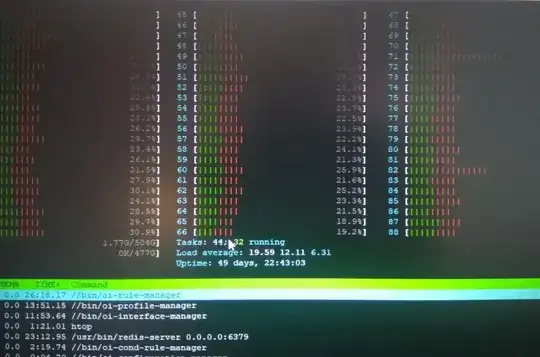
htop results perf top results

sorush-r
  • 151
  • 1
  • 5

3 Answers3

5

Sure looks like a NUMA effect when multiple sockets degrades performance drastically.

perf is very useful. Already in the perf report, you can see native_queued_spin_lock_slowpath taking 35%, which seems like a very large amount of overhead for your concurrency code. The tricky part is visualizing what is calling what, if you don't know the concurrency code extremely well.

I would recommend making flame graphs out of system wide CPU sampling. Quick start:

git clone https://github.com/brendangregg/FlameGraph  # or download it from github
cd FlameGraph
perf record -F 99 -a -g -- sleep 60
perf script | ./stackcollapse-perf.pl > out.perf-folded
./flamegraph.pl out.perf-folded > perf-kernel.svg

In the resulting graphic, look for the tallest "plateaus". Which indicate functions with the most exclusive time.

I look forward to when the bpfcc-tools package is in Debian stable, it will enable collection of these "folded" stacks directly with less overhead.

What you do with this depends on what you find. Know what critical section is being protected by a lock. Compare to existing research into scalable synchronization on modern hardware. For example, a Concurrency Kit presentation notes that different spinlock implementations have different properties.

John Mahowald
  • 30,009
  • 1
  • 17
  • 32
2

I would dare saying this is a hardware "issue". You overload the IO subsystem and it is of this kings that more paralellism makes it slower (like discs).

THe main indications are:

  • ~100 threads for IO
  • You say nothing about IO. That is typical an area inexperienced people overlook and never talk about. Typical for databases "oh, i have that much ram, but i don't tell you I run from a slow large capacity disc, why am I slow".
TomTom
  • 50,857
  • 7
  • 52
  • 134
  • The total IO is under 1MB/sec between all processes and redis. I still don't see why having more cores makes exact same software run slower. Extra cores must be idle when other cores are waiting for IO. And the threads are not all for IO. They wait for data, process it and pass it to others. – sorush-r Jul 05 '18 at 08:58
  • 1
    IO is not measured in MB/sec but in IOPS. Independent operations. Also - it may be 1MB/sec, but is it 1MB/sec because more is not needed, or because it is so busy movingheads on your slow drives that this is all you can get? Wrong measurement and mixing up cause and effect.... – TomTom Jul 05 '18 at 14:39
1

Because software manufacturers are mostly too lazy to make multi-core optimizations.

Software designers rarely design software that can use the full hardware capabilities of a system. Some very well written software can be considered good is the coin-mining software, since many of them are able to use the video card's processing power near it's maximum level (unlike the games, which never get close to utilizing the true processing power of a GPU).

A similar thing is valid for quite a lot of software now-days. They never bother to do multi-core optimizations, therefore performance will be better when running that software will less cores set at higher speed compared to more lower speed cores. In the case of more and faster cores, that cannot be an advantage all the time for the same reason: poorly written code. The program will try to split it's sub-tasks across too many cores and that will actually delay overall processing.

Overmind
  • 2,970
  • 2
  • 15
  • 24
  • I am pretty sure that we kept locks small, used threadpools wherever it was possible, and made sure that all algorithms run in parallel wherever its possible. – sorush-r Jul 05 '18 at 08:44
  • The problem can be much more complex. What do you use for debugging ? – Overmind Jul 05 '18 at 08:51
  • I am not sure why debugging is related, but we use `gdb`. We use `perf` for profiling. Can you explain what you mean by multi-core optimizations ? – sorush-r Jul 05 '18 at 08:52
  • 2
    No, it's not debug related, just wondering what do you use for that. I have encountered situations when splitting parallel tasks across too many cores causes performance issues because of the dependencies in these tasks and the problems were fixed after the debugging team made a report about where the problems that were causing large wait times were. You should provide more details about your design. In the mean time, read this also: https://developers.redhat.com/blog/2017/06/09/the-need-for-speed-and-the-kernel-datapath-recent-improvements-in-udp-packets-processing/ – Overmind Jul 05 '18 at 09:04
  • 1
    In the past I were running into similar problems with some software written in C. Understanding the [processor architecture and NUMA](http://xmodulo.com/identify-cpu-processor-architecture-linux.html) helped to solve the problem finally. – U880D Jul 05 '18 at 09:20