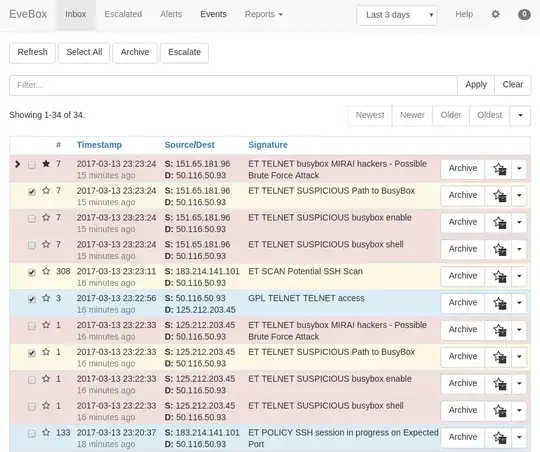
I've followed some directions for setting up Graylog and Snort (I used Suricata however) here but it would be nice to be able to see what the Alert payload was which generated the event.
An application named Snorby used to do this beautifully. You could view a hex dump of the payload to better determine the criticality of an event. As far as I know, development on Snorby ceased quite some time ago. Does anyone know if there's a way to get this sort of functionality with Graylog/Suricata? I guess if Suricata can save the payload somehow, it could be sent to Graylog somehow just not sure what mechanism would be best.
