6

I was doing a packet capture as part of a development project and saw some odd traffic coming from my machine in the capture file.

About every 3600 seconds, a NAT-PMP request is being sent to the IP "1.1.168.192". (Kind of amusing, looks like something got the endianness wrong.)

I'm concerned the machine could potentially have malware, but malware scans report nothing.

I started a packet capture filtering out only the NAT-PMP packets in question, and the packets are going out almost every hour, but not reliably every hour.

Wireshark itself can't tell me which process is sending the packets. TCPView could work, but I'd have to make sure I'm at the machine almost exactly when the packets go out, because the list doesn't retain closed or inactive connections for very long. With the packets not reliably going out every single hour, that's a frustrating proposition.

Suggestions on how to figure out which process is sending these packets at a wide interval?
I say Reinstate Monica
  • 3,100
  • 7
  • 23
  • 51
fdmillion
  • 389
  • 7
  • 14
  • 3
    Microsoft Network Monitor (deprecated but still very useful) or Microsoft Message Analyzer (complex and not easy to pick up on for a first time user) can both show the process responsible for the traffic. My preference is to use Microsoft Network Monitor because it's simple to use and easy to interpret the results. Start a capture and let it run until the suspect traffic occurs (filter by ip address and/or port). Then look at the process responsible for the traffic. – joeqwerty May 04 '17 at 02:29

2 Answers2

12

You can easily accomplish this with SysInternals' Process Monitor. Run it as Administrator, then configure it as follows:

  1. On the Filter menu click Filter...
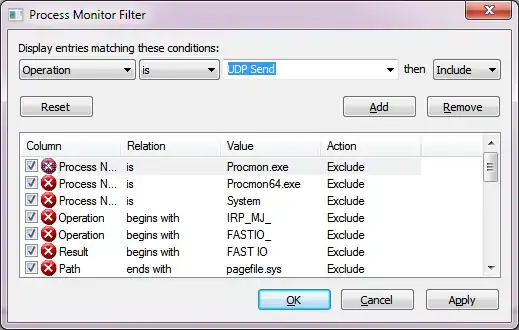
  2. In the first drop down box, select Operation. Select Is for the match condition, then in the blank drop-down box select UDP Send, then click Add.

enter image description here

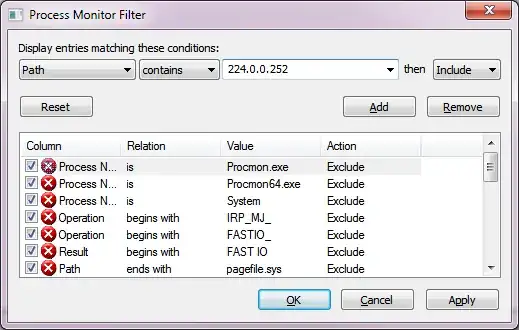
  1. Again, in the first drop-down box, select Path. Select Contains for the match condition, then enter your destination IP address in the free-text drop-down, then click Add.

enter image description here

  1. Click OK to activate the new filter.
  2. Let Process Monitor run until it finds matching traffic.

enter image description here

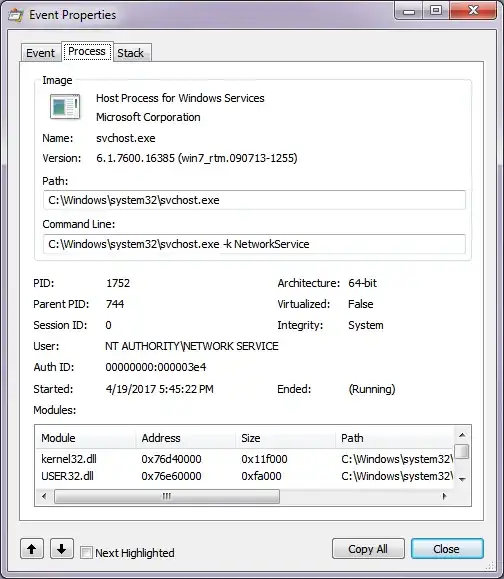
  1. Right-click on any matching entry and choose Properties, then click the Process tab to view the process associated with the outbound UDP traffic.

enter image description here

I say Reinstate Monica
  • 3,100
  • 7
  • 23
  • 51
  • Options > "Show Resolved Network Address" might have an effect on what is filtered in Path text. When you are searching with an IP address, you don't want resolved FQDN in Path, I guess. – satoc Oct 16 '20 at 10:11
-1

You can enable wire shark to show source and destination ports.

https://ask.wireshark.org/questions/1604/source-and-destination-ports-as-seperate-columns

filter by UDP and find what process is bound to the port.

You can use netstat -b to list all ports with bound processes.

nwarriorch
  • 13
  • 3