8

Our pool server disk is 100% busy.

I checked with iotop and determined that nfsd is the top process which consumes disk IO.

I need to narrow that down further and want to determine which of the NFS clients using the server is/are responsible for this disk IO bottleneck. How do I proceed?
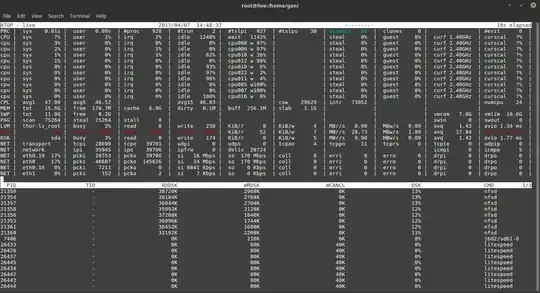
enter image description here

enter image description here

Gani Rakhmatov
  • 217
  • 3
  • 11
  • 1
    iftop will show you which client generates most of the network traffic. Very likely it will be the same client which generates the IO load. – kofemann Apr 10 '17 at 06:28
  • 1
    inspired by your question, I have build a **nfstop** to monitor shuch activity https://github.com/kofemann/nfstop – kofemann Apr 18 '17 at 12:29

2 Answers2

5

iotop and then o - you will see which process reads and/or writes and how much to the HDD.

Check the pid of that process and do netstat -entp | grep <pid> - that way you will see established tcp connection and from which address it's coming. Use enp to check for both tcp and udp sessions.

You can also do a netstat -anp | grep 2049 - that way getting an ip address and pid, then correlate the pid to the one from iotop.

13dimitar
  • 2,360
  • 1
  • 12
  • 15
2

Usually the client using most IO will also doing most network traffic, so what I do is: dump all traffic for a few seconds, and then create a sorted list of the hosts (limited to the nfs hosts) that used most traffic:

tcpdump > dump.cap  # (30 secs should be enought), press ctr+ c
grep -o "<something iding an nfs client>" dump.cap | sort | uniq -c | sort -n
Jens Timmerman
  • 866
  • 4
  • 10