2

enter image description here

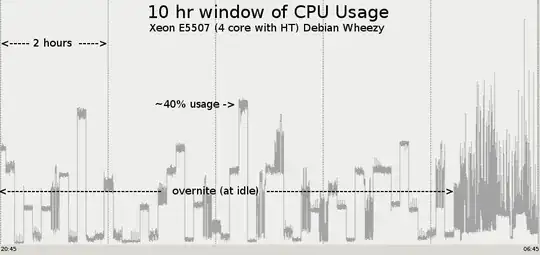
The CPU usage graph above was generated by running psensor overnight on my linux box. Note the 10 minute bursts of activity consuming up to 40% of the Xeon. The machine ought to have been at idle overnight except for possibly administrative processes configured by default with a single-user desktop setup of Debian. The window height is 67% (due to a brief spike on the far right).

How can I find out which processes are causing these 10 minute long bursts of CPU usage? Ideally, it would be helpful to have similar plots for each process.

mike
  • 23
  • 4

4 Answers4

1

Looking at the chart, it seems to me like the periods of high CPU utilization happen on whole or half hours, which points toward something running through cron. If you want to start investigating through that route, that's where I would start.

That said, given that the bursts of high CPU utilization are fairly long (ten minutes in your case), you could simply dump system state through a cron job of your own to analyze in the morning.

I'd suggest using top's batch mode (-b) with an iteration count of 1 (-n 1), so you'd add something like the following to a new file in /etc/cron.d:

* * * * * root top -b -n 1 > /var/log/processes/$(date +%F_%R)

Remember to create a directory /var/log/processes for this to write into.

In the morning, pick out one or a few of these files from a period of high CPU utilization and look more closely at them.

The default sort order appears to be highest current CPU utilization on top, which should work well in your case. Otherwise, you can simply import the file into a spreadsheet application (it should import just fine as fixed-width data) and sort on the %CPU field. Once you know the name of the binary, you can either look for it on disk (including using dpkg -S to figure out what package it belongs to), or amend the above with something like pstree to get an idea of what led to that particular binary being invoked.

That, in turn, should give you a good idea of which actual programs (not just processes) are hogging CPU, allowing you to determine whether it's even a problem, and if you think it is a problem then allow you to figure out how to turn it off.
user
  • 4,267
  • 4
  • 32
  • 70
0

I think you have to code it on your own to get information about which process is taking the cpu.

There was a previous discussion on that here that may save you some time:

How do I log CPU usage per process?

ignivs
  • 449
  • 5
  • 11
  • thanks, prior to posting my Q, i read several threads with code-your-own answers. difficult to believe there is not a graphical 'top' that I could let run overnight. – mike Mar 15 '16 at 14:38
0

I used https://sealion.com/ when it first launched and it monitors and records system information, such as capturing the output of top and the like. Maybe it'll give you what you need to track the problem down.

Safado
  • 4,726
  • 7
  • 35
  • 53
  • thanks, I believe sealion.com is cloud based, uploading your system data to their servers. Before resorting to that, I'd script the data and time stamps into logfiles – mike Mar 15 '16 at 16:17
0

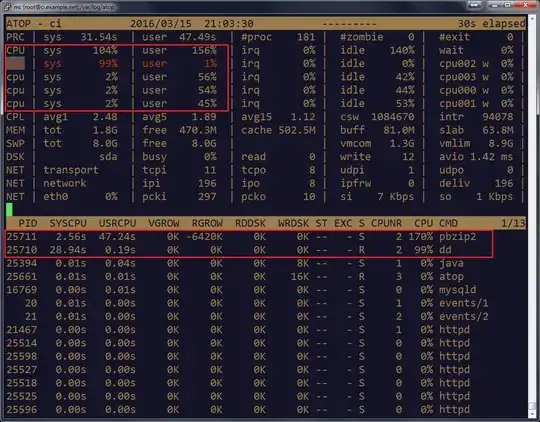
I would suggest to use atop with 30 seconds interval to capture the data. Then you can easily navigate at any point (t - forward/ shift + t - backward) and get extended statistics - cpu/io/network loads and so on.

enter image description here

enter image description here

ALex_hha
  • 7,025
  • 1
  • 23
  • 39