3

See attached picture of Fusion Reactor, showing pages that just keep on running. Times have gone up into the millions and I've left them to see if they'd complete but that was when there were just 2 or 3.

Now I'm getting dozens of pages that just never finish. And it's different queries, I can't see any huge pattern except it only seems to apply to 3 of my 7 databases.

top shows coldfusion CPU usage around 70-120%, and digging deeper into the Fusion Reactor details pages shows all the time building up is spent solely on Mysql queries.

show processlist returns nothing unusual, execpt 10 - 20 connections in sleep state.

During this time many pages do complete, but as the the number of pages hanging builds up and they never seem to finish the server eventually just returns white pages.

The only short term solution seems to be restarting Coldfusion, which is far from ideal.

A Node.js script was recently added that runs every 5 minutes and checks for batch csv files to process, I wondered if that was causing a problem with stealing all the MySQL connections so I've disabled that (the script has no connection.end() method in it) but that's just a quick guess.

No idea where to start, can anyone help?

The worst part is the pages NEVER time out, if they did it wouldn't be so bad, but after a while nothing gets served.

I'm running a CentOS LAMP stack with Coldfusion and NodeJS as my primary scripting languages

really long requests that never fail

UPDATE BEFORE ACTUALLY POSTING

During the time it took to write this post, which I started after disabling the Node script and restarting Coldfusion, the problem seems to have gone away.

But I'd still like some help identifying exactly why the pages woudlnt' time out and confirming that the Node script needs something like connection.end()

Also it might only happen under load, so I'm not 100% sure it has gone away

UPDATE

Still having issues, I've just copied one of the queries that is currently up to 70 seconds in Fusion Reactor, and run it manually in the database and it completed in a few milliseconds. The queries themselves don't seem to be a problem.

ANOTHER UPDATE

Stack trace of one of the pages still going. Server hasn't stopped serving pages in a while, all Node scripts currently disabled

http://pastebin.com/D6ycJf3X

MORE UPDATES

I had a few more of these today - they actually finished and I spotted this error in FusionReactor:

Error Executing Database Query. The last packet successfully received from the server was 7,200,045 milliseconds ago. The last packet sent successfully to the server was 7,200,041 milliseconds ago. is longer than the server configured value of 'wait_timeout'. You should consider either expiring and/or testing connection validity before use in your application, increasing the server configured values for client timeouts, or using the Connector/J connection property 'autoReconnect=true' to avoid this problem.

EVEN MORE UPDATES

Digging around the code, I tried looking for "2 h", "120" and "7200" as I felt the 7200000ms timeout was too much of a coincidence.

I found this code:

// 3 occurrences of this
createObject( "java", "coldfusion.tagext.lang.SettingTag" ).setRequestTimeout( javaCast( "double", 7200 ) );

// 1 occurrence of this 
<cfsetting requestTimeOut="7200">

The 4 pages that reference those lines of code are run very rarely, have never shown up in the logs with the 2h+ time outs and are in a password protected area so can't be scraped (they were for file uploads and CSV processing, now moved to nodejs).

Is it possible that these settings could somehow be set by one page but exist in the server, and affect other requests?
Pete
  • 283
  • 1
  • 5
  • 19
  • Shot in the dark here, but it could be that the sql was in a transaction that wasn't committed until the connection ended. Explicitly committing the transactions might resolve this problem. More of a code response than a server response, but worth taking a quick look – Gerry Gurevich Oct 15 '15 at 09:48
  • The variety of CF pages that are failing I can't see it being them, as so many pages at once shouldn't have gone wrong so I think that would be the node side of things. That script has been disabled anyway, and it's still happening but I will look at the code – Pete Oct 15 '15 at 09:53
  • @GerryGurevich sorry I missed your comment, it's a good idea and I'll give it a try. I've spoken to Rackspace and they've said it's likely caused by some internal network issues they have at the moment, so a code based solution might be my only option right now. I need to wrap the DB connections in something that will timeout if they take too long instead of getting stuck – Pete Nov 13 '15 at 14:13

2 Answers2

4

1) post a stack trace.

I gurantee they will be hanging on Socket.read() (or similar)

What is occouring is that 1/2 of the tcp connection to the db is being closed, leaving c.f. waiting for a response it will never get.

There are network issues between the c.f. box and the db.

Java db drivers in general are poor at dealing with this


Thanks for the stack trace

This confirms my assumption that it's 1/2 the tcp connection closing.

I suspect one of the following 1) mysql is on linux and there is a bug in the TCP stack, so you need to upgrade linux on that box - yes I have seen this before 2) coldfusion is on linux .. .as per 1) 3) there is a faulty cable / hardware on or between either of the boxes 4) if you are running windows DISABLE TCP OFFLOAD!!!

number 3) is the hard one. You would need to run wireshark on both boxes & prove packet loss. The simpler solution would be to move the Rackspace VM's to different physical hosts & see if it goes away. (There is a rare chance your code is very very bad and you are saturating the network between the CF box and the MySQL box, but I'm not sure it's possible to write code that bad)

Sven
  • 97,248
  • 13
  • 177
  • 225
  • Where would I get the stack trace from, when the pages aren't actually erroring, so I never get anything in Fusion Reactor? – Pete Oct 15 '15 at 12:44
  • 1
    +1000 to posting a stack trace. That is your go-to information for finding out what a thread is doing. Click the little icon with the horizontal lines next to a running request to get the current stack. Stack traces don't just exist for exceptions! Every thread has a stack at all times that shows you exactly what it's doing right then. – Brad Wood Oct 15 '15 at 16:11
  • Lovely, I get ya. Will do asap! – Pete Oct 15 '15 at 16:44
  • Pastebin to stack trace in main question – Pete Oct 15 '15 at 19:25
  • Top of the stack trace is a Socket.read(). The CF and DB are different Rackspace servers, they communicate via the private IPs – Pete Oct 15 '15 at 19:27
  • The pages all timed out and with proper 404s last night, just short of 8M ms, so just over 2 hours. I think it has something to do with my Nodejs scripts not using `connection.end()` – Pete Oct 16 '15 at 07:16
  • Rackspace just migrated one of our servers so I don't think it's no 3. as the problem is still there. I am running a Linux server, I'll see if they need update, maybe that will fix it... – Pete Nov 04 '15 at 11:40
  • And I haven't ruled out the rare, rare chance... but we are going through any badly performing page at the moment in the hopes we have left something in. We've sped some pages up but are still getting these issues. – Pete Nov 04 '15 at 11:41
  • Rackspace have confirmed there are infact networking issues on their internal networks, so I'm going to have to come up with a work around in the mean time. I'm sure I can get CF to end the connection or cancel the request if it goes past 2m - which is how long our LB waits anyway – Pete Nov 13 '15 at 14:15
0

I've spent some more time looking into this and have some more detail to add about the specific cause of the network problems and a work around found with some help from Charlie Arehart.

Firstly, the network connection was being interrupted by an automated script triggering iptables restart. This was updating a list of IP address that could access the server but also breaking any connections between the application and DB server.

It was more likely to happen on slower pages or those that ran more frequently but anything that coincided with the iptables restart code would get cut off.

Rackspace found this for me and suggested changing the code from:

/sbin/service iptables restart

to

/sbin/iptables-restore < /etc/sysconfig/iptables

This stops the service being restarted and just applies to new connections.

This was the root cause of the problem but the real issue is the fact that Coldfusion, or really the JDBC underneath would not stop waiting for the response from the DB server.

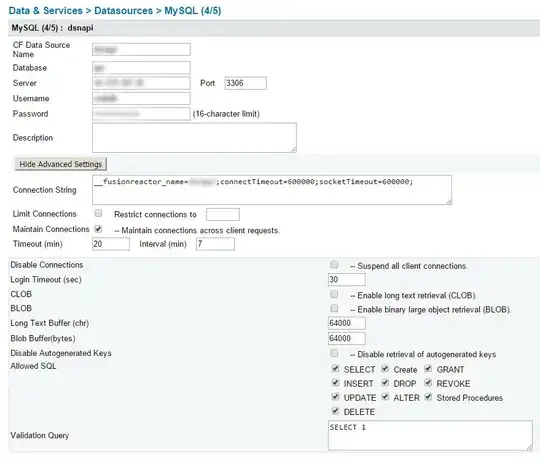
I'm not sure where the 2 hour timeout came in (assuming it's a default) but Charlie showed a way to set a lower time out in the CFIDE connection string - this tells CF to wait a maximum time before giving up on the DB.

So our connection string is:

__fusionreactor_name=datasourcename;connectTimeout=600000;socketTimeout=600000;

I can't remember the specifics of these 2 but they are setting a time in milliseconds to wait and then give up on the db connection:

  • connectTimeout=600000;
  • socketTimeout=600000;

This one is simply labeling the datasource in Fusion Reactor - if you have it, it's very useful for finding problems in your CF applications. If you don't have Fusion Reactor then leave this bit out.

  • __fusionreactor_name=dsnapi;

You'll have to apply this to EACH datasource in your CFIDE

CFIDE datasource panel showing connection string

Pete
  • 283
  • 1
  • 5
  • 19