So we have a server that has seemingly random spikes in disk I/O, going up to 99.x% at random times and for no obvious reason, staying high for a while, and then going back down. This didn't use to be an issue, but recently the disk I/O has been staying at 99% for extended periods of time, in some cases up to 16 hours.
The server is a dedicated server, with 4 CPU cores and 4 GBs of RAM. It is running Ubuntu Server 14.04.2, running percona-server 5.6 and nothing else major. It is being monitored for downtime and we have a screen permanently showing CPU/RAM/Disk I/O for the servers we deal with. The server is also being regularly patched and maintained.
This server is the 3rd in a chain of replicas, and is there as a fail-over machine. The MySQL data flow is as follows.
Master --> Master/Slave --> Problem Server
All 3 machines have identical specs and are hosted with the same company. The problem server is in a different datacentre to the first & second.
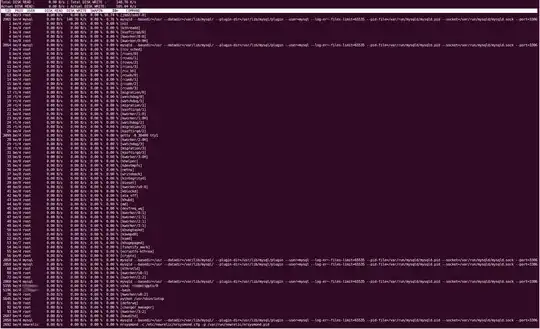
The 'iotop' tool shows us that the disk I/O is being caused by the 'jbd2/sda7-8' process. From what we know this handles the filesystem journalling, and flushing things to disk. Our 'sda7' partition is '/var' and our sda8 partition is /home. Nothing should be reading/writing to /home on a regular basis. Stopping the mysql service results in the disk I/O immediately dropping back down to a normal level so we are fairly certain it is percona that is causing the issue, and this would match with it being the /var partition as this is where our MySQL data directory resides (/var/lib/mysql).
We use NewRelic to monitor all of our servers, and when the disk I/O spikes, we can not see anything that could be causing it. The load average sits at ~2. The CPU usage hovers at ~25%, which NewRelic says is being caused by 'IO Wait' rather than a particular process.
Our mysql configuration file was generated through a combination of the Percona configuration wizard and some settings that are required for our customers app, but is nothing particularly fancy.
MySQL config - http://pastebin.com/5iev4eNa
We have tried the following things to try and resolve the issue:
Ran mysqltuner.pl to see if there was anything obviously wrong. Results look very similar to the results from the same tool on the other 2 database servers, and does not change much between uses.
Used vmstat, iotop, iostat, pt-diskstats, fatrace, lsof, pt-stalk and probably a few more, but nothing obvious has jumped out.
Tweaked the 'innodb_flush_log_at_trx_commit' variable. Have tried setting it to 0, 1 & 2, but none seemed to have any effect. This should have changed how often MySQL was flushing transactions to the logs files.
A mysql 'show full processlist' is very un-interesting when disk-I/O is high, it just shows the slave reading from the master.
Some of the outputs from tools are obviously quite long so I'll give pastebin links, and I couldn't manage to copy-paste the output of iotop, so I've provided a screen capture instead.
iotop

pt-diskstats: http://pastebin.com/ZYdSkCsL
When the disk I/O is high, “vmstat 2” shows us the things being written are mostly because of “bo” (buffer out), which correlates with the disk journalling (flushing buffers/RAM to disk)
“lsof -p mysql-pid” (list open files of a process) shows us that the files being written to are mostly .MYI and .MYD files in the /var/lib/mysql directory, and the master.info and relay-bin and relay-log files. Even without specifying the mysql process(so any file being written on the entire server), the output is very similar (mostly MySQL files, not much of anything else) This confirms for me that it is definitely being caused by Percona.
When disk I/O is high, the “seconds_behind_master” increases. I’m not sure which way round they happen as of yet. “seconds_behind_master” also jumps from normal values to arbitrarily large values temporarily, and then returns to normal pretty much straight away, some people have suggested this could be caused by network issues.
'show slave status' - http://pastebin.com/Wj0tFina
The RAID controller (3ware 8006) does not have any caching abilities; someone also suggested poor caching performance could be causing the issue. The controller has identical firmware, version, revision etc. as cards on other servers for the same customer (albeit webservers), so I’m fairly certain it is not at fault. I have also ran verifications of the array, which came back fine. We also have the RAID checking script which would have alerted us to any changes.
The network speeds are terrible compared to those on the second database server, so I’m thinking that maybe this is a network issue. This also correlates with spikes in bandwidth just before the disk I/O goes high. However, even when the network does “spike”, it doesn’t spike to a high amount of traffic, just relatively high compared to the average.

Network speeds (generated using iPerf to an AWS instance)
Problem server - 0.0-11.3 sec 2.25 MBytes 1.67 Mbits/sec Second server - 0.0-10.0 sec 438 MBytes 366 Mbits/sec
Apart from being slow, the network seems to be fine. No packet loss, but some slow hops between servers 
Will be happy to also provide output of any relevant commands but I can only add 2 links to this post as I'm a new user :(
EDIT We got in touch with our hosting provider regarding this issue, and they were kind enough to swap the hard disks for SSDs of the same size. We rebuilt the RAID onto these SSDs, but unfortunately the problem persists.