Let me start with picture:
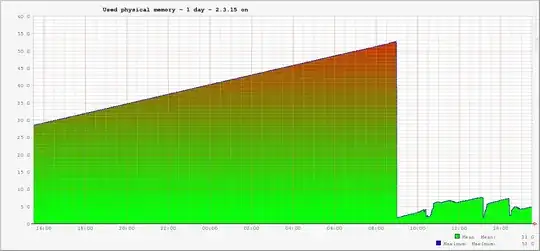
This is memory usage of our backup Tomcat server. It is just hanging there, processing simple healt check request every couple fo seonds and waiting for main server's crash to take the load. And it still has this growing memory usage. The main server has the same growing memory. And sooner or later, Nagios starts spamming SMSes and emails about memory and swap use.
Both servers are running CentOS 7, kernel 3.10, Java 1.7 and Tomcat 7.
Even when I stop the Tomcat server using systemctl stop tomcat, the memory still stays used.
Only way I found to free the memory is sync && echo 3 > /proc/sys/vm/drop_caches. So, the workaround is to put this in cronjob. But I'd like to found a proper solution.
I found this thread about similar problem, and it mentions setting MALLOC_ARENA_MAX to 4 (and some other threads advice to just 1) and I also found a thread saying it should work with MALLOC_CHECK_ environment variable. But it does not. That's what you can see at the right part of the chart.
If I look ad Used memory, it stays around 600 MB and Used non-heap memory is at 70 MB.
Do you have any idea what might be causing this and how to fix this? And I repeat, the memory is not freed after Tomcat is stopped, so I don't believe it's leak in our app.
# free -m
             total       used       free     shared    buffers     cached
Mem:         64268       4960      59307         64          0        135
-/+ buffers/cache:       4824      59443
Swap:         2047          0       2047

# ps -eo rss | awk '{sum += $1}; END {print sum/1024/1024}'
2.54199
Update from this morning, 9 hours after cronjob freed the memory:
# free -h
             total       used       free     shared    buffers     cached
Mem:           62G        13G        48G        80M         0B        77M
-/+ buffers/cache:        13G        48G
Swap:         2,0G         4K       2,0G

# ps -eo vsize | awk '{sum += $1}; END {print sum/1024/1024}'
25.8389

# ps -eo rss | awk '{sum += $1}; END {print sum/1024/1024}'
1.24232

# ps -eo pmem,rss,vsize,args | grep tomcat
 1.7  1158608 22684408 java -classpath /usr/share/tomcat/bin/bootstrap.jar:/usr/share/tomcat/bin/tomcat-juli.jar:/usr/share/java/commons-daemon.jar -Dcatalina.base=/usr/share/tomcat -Dcatalina.home=/usr/share/tomcat -Djava.endorsed.dirs= -Djava.io.tmpdir=/var/cache/tomcat/temp -Djava.util.logging.config.file=/usr/share/tomcat/conf/logging.properties -Djava.util.logging.manager=org.apache.juli.ClassLoaderLogManager org.apache.catalina.startup.Bootstrap start
This is getting really weird. There is running keepalived which keeps sending HTTP request to health check function of our app via curl every few seconds. If I stop the keepalived, the memory stops growing. If I send the same curl request in infinite loop from bash on the same machine, the memory starts growing again. Even if I send the request to URL returning 404. If I start the same loop on different machine (so not from localhost), the memory is ok.
# slabtop -o
 Active / Total Objects (% used)    : 244359165 / 244369016 (100,0%)
 Active / Total Slabs (% used)      : 5810996 / 5810996 (100,0%)
 Active / Total Caches (% used)     : 70 / 99 (70,7%)
 Active / Total Size (% used)       : 45770306,72K / 45772288,52K (100,0%)
 Minimum / Average / Maximum Object : 0,01K / 0,19K / 8,00K

  OBJS ACTIVE  USE OBJ SIZE  SLABS OBJ/SLAB CACHE SIZE NAME
243660018 243660018  11%    0,19K 5801429       42  46411432K dentry
143872 141868  98%    0,03K   1124      128      4496K kmalloc-32
118150 118150 100%    0,02K    695      170      2780K fsnotify_event_holder
 87040  87040 100%    0,01K    170      512       680K kmalloc-8
 80448  79173  98%    0,06K   1257       64      5028K kmalloc-64
 56832  56832 100%    0,02K    222      256       888K kmalloc-16
 31926  31926 100%    0,08K    626       51      2504K selinux_inode_security
 31140  31140 100%    0,11K    865       36      3460K sysfs_dir_cache
 15795  14253  90%    0,10K    405       39      1620K buffer_head
 15008  14878  99%    1,00K    469       32     15008K xfs_inode
 14616  13365  91%    0,19K    348       42      2784K kmalloc-192
 11961  11714  97%    0,58K    443       27      7088K inode_cache
 10048   9108  90%    0,06K    157       64       628K anon_vma
  9664   9480  98%    0,12K    302       32      1208K kmalloc-128
  9287   7954  85%    0,21K    251       37      2008K vm_area_struct
  8624   8624 100%    0,07K    154       56       616K Acpi-ParseExt
  7264   7063  97%    0,25K    227       32      1816K kmalloc-256
  5908   5908 100%    0,57K    211       28      3376K radix_tree_node
  5304   5304 100%    0,04K     52      102       208K Acpi-Namespace
  4620   4620 100%    0,09K    110       42       440K kmalloc-96
  3744   3586  95%    1,00K    117       32      3744K kmalloc-1024
  3458   3458 100%    0,30K    133       26      1064K nf_conntrack_ffffffff819a29c0
  3360   3067  91%    0,50K    105       32      1680K kmalloc-512
  3108   3108 100%    0,38K     74       42      1184K blkdev_requests
  2975   2975 100%    0,05K     35       85       140K shared_policy_node
  2520   2368  93%    0,64K    105       24      1680K proc_inode_cache
  1560   1560 100%    0,81K     40       39      1280K task_xstate
  1300   1300 100%    0,15K     50       26       200K xfs_ili
  1272   1272 100%    0,66K     53       24       848K shmem_inode_cache
  1176   1176 100%    1,12K     42       28      1344K signal_cache
  1024   1024 100%    2,00K     64       16      2048K kmalloc-2048
   975    975 100%    0,62K     39       25       624K sock_inode_cache
   900    900 100%    0,44K     25       36       400K scsi_cmd_cache
   864    864 100%    0,25K     27       32       216K tw_sock_TCPv6
   737    644  87%    2,84K     67       11      2144K task_struct
   720    672  93%    2,00K     45       16      1440K TCPv6
   704    704 100%    0,18K     16       44       128K xfs_log_ticket
   665    665 100%    0,23K     19       35       152K cfq_queue
   646    646 100%    0,94K     19       34       608K RAW
   640    640 100%    0,39K     16       40       256K xfs_efd_item
   624    624 100%    0,10K     16       39        64K blkdev_ioc
   624    624 100%    0,20K     16       39       128K xfs_btree_cur
   578    578 100%    0,12K     17       34        68K fsnotify_event
   555    555 100%    2,06K     37       15      1184K sighand_cache
   528    528 100%    0,48K     16       33       256K xfs_da_state
   512    512 100%    0,06K      8       64        32K kmem_cache_node
   512    512 100%    1,00K     16       32       512K UDP
   465    465 100%    2,06K     31       15       992K idr_layer_cache
   450    450 100%    0,62K     18       25       288K files_cache