I'm using a PC Engines APU device running FreeBSD as a NAT router. The setup is very usual: one WAN connection and one LAN connection.
Theoretically, WAN connection is 800/40 Mbit/s and the LAN one is 1/1 Gbit/s. In practice, the router is connected via gigabit ethernet both to a modem (WAN) and to a Netgear switch (LAN).
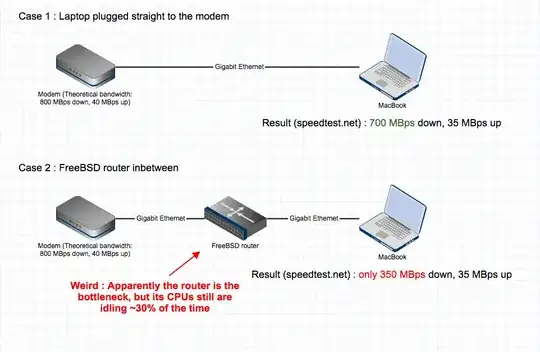
If I plug a fast PC straight to the WAN connection (modem), I can reach actual download speeds of about 700 MBit/s. But if the router is inbetween, there is a severe performance hit and download speeds never get above 350 MBit/s.
Which could be easily explained by the router not being powerful enough.
Thing is, I tried to see what was going on, and when trying to max out the connection (actual bandwidth measured being 350 MBit/s), the router's CPUs are both idle about 30% of the time.
I understand this means that the CPU isn't the bottleneck. But then, what is? Is there a way to diagnose what the router is actually doing more accurately and why it's only running at half of the capacity?
In order to make my question clearer, here are some additional details.
First, a visual representation of the issue:
Then and for reference, the output of top -S -C -H -P -s1 -ocpu
When there is very little traffic on the router:
last pid: 14077;  load averages:  0.00,  0.00,  0.00    up 0+18:13:58  12:02:53
118 processes: 3 running, 98 sleeping, 17 waiting
CPU 0:  0.0% user,  0.0% nice,  0.8% system,  0.0% interrupt, 99.2% idle
CPU 1:  0.0% user,  0.0% nice,  0.8% system,  0.0% interrupt, 99.2% idle
Mem: 16M Active, 89M Inact, 130M Wired, 497M Buf, 3678M Free
Swap: 8192M Total, 8192M Free

  PID USERNAME PRI NICE   SIZE    RES STATE   C   TIME     CPU COMMAND
   11 root     155 ki31     0K    32K CPU1    1  18.0H 100.00% idle{idle: cpu1}
   11 root     155 ki31     0K    32K RUN     0  18.0H 100.00% idle{idle: cpu0}
14077 root      20    0 21996K  3120K CPU0    0   0:00   0.10% top
   12 root     -92    -     0K   272K WAIT    1   5:22   0.00% intr{irq259: re0
   12 root     -92    -     0K   272K WAIT    0   4:21   0.00% intr{irq260: re1
    9 root     -16 ki-1     0K    16K pollid  0   1:51   0.00% idlepoll
   12 root     -60    -     0K   272K WAIT    0   1:40   0.00% intr{swi4: clock
    0 root     -16    0     0K   160K swapin  1   0:37   0.00% kernel{swapper}
    5 root     -16    -     0K    16K pftm    0   0:31   0.00% pf purge
24147 root      20    0 12464K  2176K select  0   0:25   0.00% apinger
11846 root      52   20 17144K  2692K wait    1   0:12   0.00% sh
52774 root      20    0 28172K 18060K select  1   0:10   0.00% ntpd{ntpd}
   15 root     -16    -     0K    16K -       0   0:09   0.00% rand_harvestq
87531 dhcpd     20    0 24820K 13576K select  1   0:08   0.00% dhcpd
44974 unbound   20    0 47020K 19840K kqread  0   0:08   0.00% unbound{unbound}
   20 root      16    -     0K    16K syncer  0   0:05   0.00% syncer
And when I try to max out the WAN connection (and only got 318 MBit/s in that case):
last pid: 41402;  load averages:  0.02,  0.01,  0.00    up 0+18:15:40  12:04:35
118 processes: 4 running, 98 sleeping, 16 waiting
CPU 0:  0.0% user,  0.0% nice,  0.7% system, 34.3% interrupt, 64.9% idle
CPU 1:  0.0% user,  0.0% nice,  0.0% system, 68.7% interrupt, 31.3% idle
Mem: 16M Active, 89M Inact, 130M Wired, 497M Buf, 3678M Free
Swap: 8192M Total, 8192M Free

  PID USERNAME PRI NICE   SIZE    RES STATE   C   TIME     CPU COMMAND
   11 root     155 ki31     0K    32K CPU0    0  18.0H  82.86% idle{idle: cpu0}
   11 root     155 ki31     0K    32K RUN     1  18.1H  69.87% idle{idle: cpu1}
   12 root     -92    -     0K   272K WAIT    1   5:27  32.86% intr{irq259: re0
   12 root     -92    -     0K   272K CPU0    0   4:23  17.19% intr{irq260: re1
14077 root      20    0 21996K  3232K CPU0    0   0:01   0.10% top
    9 root     -16 ki-1     0K    16K pollid  0   1:51   0.00% idlepoll
   12 root     -60    -     0K   272K WAIT    0   1:40   0.00% intr{swi4: clock
    0 root     -16    0     0K   160K swapin  0   0:37   0.00% kernel{swapper}
    5 root     -16    -     0K    16K pftm    1   0:31   0.00% pf purge
24147 root      20    0 12464K  2176K select  0   0:25   0.00% apinger
11846 root      52   20 17144K  2692K wait    0   0:12   0.00% sh
52774 root      20    0 28172K 18060K select  1   0:10   0.00% ntpd{ntpd}
   15 root     -16    -     0K    16K -       0   0:09   0.00% rand_harvestq
87531 dhcpd     20    0 24820K 13576K select  1   0:08   0.00% dhcpd
44974 unbound   20    0 47020K 19840K kqread  1   0:08   0.00% unbound{unbound}
   20 root      16    -     0K    16K syncer  0   0:05   0.00% syncer