6

I'm running a load test against a web service. It's a php application running on php-fpm and nginx, with fastcgi. There is a MySQL backend being used for small reads only.

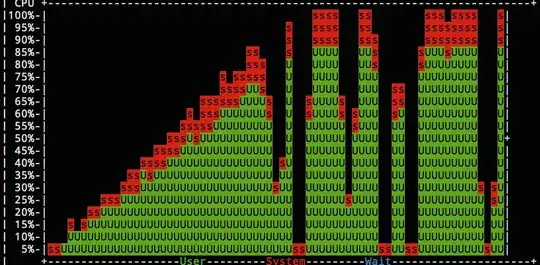
Invariably, I'm seeing a peculiar pattern: performance is steady and increases predictably as traffic ramps up, but then it becomes unstable right at the peak: the CPU usage fluctuates constantly.

Here is the performance pattern I'm seeing (visualised with nmon):
enter image description here

The drop-off always coincides with the brief pause that my load testing tool - locust.io - has when it finishes ramping up to the peak level I've set for the test.

My hypothesis: During this brief moment, the php-fpm master thinks that the load has disappeared and start to kill workers; it's not able to respond quickly enough when the traffic comes back in full swing a moment later.

What I don't quite understand is why it's never quite able to get back into the swing of it: I see this fluctuation indefinitely across all 4 application servers behind the load balancer.

Here is my php-fpm pool config:

[www]
user = www-data
group = www-data
listen = /var/run/php5-fpm.sock
listen.group = www-data
listen.mode = 0660
pm = dynamic
pm.max_children = 100
pm.start_servers = 40
pm.min_spare_servers = 40
pm.max_spare_servers = 100
pm.max_requests = 10000

I've already confirmed that it's not an issue with the database - I saw the exact same behaviour after doubling the number of MySQL read slaves.

What is causing this? How can I stop it?

EDIT:

Here is a graph that demonstrates what I'm seeing. Note that the failure rate usually spikes just as the user_count peaks, and gradually settles back down.

user_count vs fail_ratio

Cera
  • 533
  • 3
  • 6
  • 12
  • 2
    Your `max_spare_servers` is equal to `max_children` so it should never kill workers until they get recycled due to `max_requests`. So that's probably not it. – Michael Hampton Oct 29 '14 at 04:07
  • 2
    Did you confirm the absence of this problem when you run it with pm = static, with about 100 servers? Otherwise, your hypothesis doesn't hold. – Willem Nov 08 '14 at 21:34
  • Did you try with an alternative load tester like Siege, Yandex Tank, AB etc. That way you could figure whether it's just the way locust goes about peppering your server. Note that Tengine (Nginx fork) has SO_REUSEPORT support and its ngx_http_sysguard_module can protect the server under stress. If you get the same behaviour with Tengine, the problem may lie elsewhere in yout stack. – JayMcTee Jun 17 '15 at 10:22

2 Answers2

1

What about your memory management? The last weeks i did some simlar tests and brought one server to the limit. I saw a lot of changes to the memory. In my case huge amount of data was brought into the swap instead of the RAM to handle the load. After one test i had a real strange result, no RAM was used anymore and complete all was gone to the swap. Maybe this is what the following requests is slowing down.

This is a example image how my swap looked like after a load test enter image description here

Deex
  • 129
  • 6
0

What's happening with disk IO and locking? Presumably if your process is CPU bound up to a point where that changes, then something else is busy, and it's most likely to be your disk.

Are you hitting memory limits that would cause you to start swapping? How much RAM do your PHP processes use (RSS)? How much RAM do you have available? Do you get similarly fluctuating performance if you knock back the number of PHP processes? At what level does the fluctuation appear?

Note that pm.max_children = 100 is probably far too high. Unless you are dealing with long-running requests like big downloads, you're probably better to reduce it a lot. I hesitate to specify a number without knowing what the system is doing, but probably something in the 5-40 range will work much better. pm.max_requests is also likely to be far too high. You'll probably find that you get little benefit, and more likely significant degradation if that goes over 100 or so, and if what's being run by php is highly variable and memory consuming, or you have memory leaks, then you'll do better reducing it quite a bit further. If you really don't know what works, start with each of these settings about 30 and experiment.

Is PHP generating sessions? How are they stored? If they are on a file system, what sort of file system is it? In some cases you get a bottleneck with locking on the directory they are in. using a hashed directory structure for them or using e.g. memcached can help with that.

What does strace run against the PHP processes report is taking the time? You can look at that with a compound command along these lines:

(ps wwaux | grep '^www-data.*php' |  awk '{print $2}' \
  | xargs -n 1 -P 32 strace -r -p ) 2>&1 
  | perl -ne '($n) = /^ *(\d*\.\d*)/; print "$n\t$_" if ((defined $n) and ($n > 0.01))'
mc0e
  • 5,786
  • 17
  • 31