5

High CPU

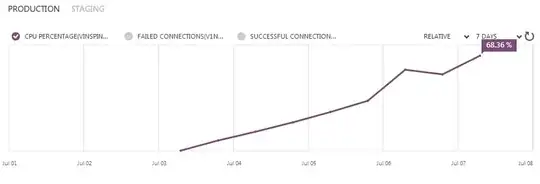
The picture explains it all. We have had a problem with an IIS MVC 5 website hosted on Microsoft Azure over the last several months. The site appears to continually eat up CPU over a few days until it reaches 100% CPU. I have used Perfmon/DebugDiag to capture what is going on when the server hits 100% with no positive findings. I've also monitored IIS worker processes to see if it is any one particular request hanging, but all requests are being processed quickly (until 100%). Grasping at straws - we have had peer checks of code to ensure no bad loops/string concats are occurring.

My guess is this has something to do with the garbage collector... Resetting the app pool fixes the issue (for a few days).

Any insight would be appreciated as to how to debug this further. I have followed this Microsoft article without success: http://www.iis.net/learn/troubleshoot/performance-issues/troubleshooting-high-cpu-in-an-iis-7x-application-pool

Thanks.

  • Did you manage to reach a resolution on this? – NikolaiDante Jun 25 '15 at 16:28
  • Try using https://technet.microsoft.com/en-us/sysinternals/bb896653 to inspect the process. You may find multiple app domains running in the worker process or some other quirk. – Greg Bray Jun 26 '15 at 05:27
  • @NikolaiDante we did not find a solution to the problem. We added a hack to our deployments to setup our application pool to have a daily periodic restart schedule. – Bill Christenson Apr 25 '18 at 13:50
  • How generates the picture ? How you use ***Perfmon/DebugDiag*** to capture what is going on when `the server hits 100%` with no positive finding ? How you `monitored IIS worker processes` ? can yo do all this ***programmatically*** ? – Kiquenet Jul 02 '18 at 12:35
  • For Azure App Service (today's name), it is very important to collect dumps when CPU usage is high and analyze them to locate the culprit. Articles like https://blogs.msdn.microsoft.com/asiatech/2016/01/20/how-to-capture-dump-when-intermittent-high-cpu-happens-on-azure-web-app/ and https://serverfault.com/questions/774737/how-to-identify-the-cause-of-100-cpu-usage-in-azure-app-service should be followed (though through the years Azure Portal might look differently). – Lex Li Nov 17 '19 at 16:55

1 Answers1

0

Garbage collection is typically memory related, not CPU related. Of course, you could have objects that have routines in them that are looping and those objects are slowly growing or the time between loop iterations are decreasing. Yes, you need to profile your processes as this would tell you which methods are causing all of the CPU time. I recommend Telerik's JustTrace tool, although there are many others out there.

One other thought, you may think you have disposed of your object but the loop is still running. Consider terminating your loops gracefully with a cancellation token or condition.

user594643
  • 36
  • 2