Scenario: We have a number of Windows clients regularly uploading large files (FTP/SVN/HTTP PUT/SCP) to Linux servers that are ~100-160ms away. We have 1Gbit/s synchronous bandwidth at the office and the servers are either AWS instances or physically hosted in US DCs.
The initial report was that uploads to a new server instance were much slower than they could be. This bore out in testing and from multiple locations; clients were seeing stable 2-5Mbit/s to the host from their Windows systems.
I broke out iperf -s on a an AWS instance and then from a Windows client in the office:
iperf -c 1.2.3.4
[  5] local 10.169.40.14 port 5001 connected with 1.2.3.4 port 55185
[  5]  0.0-10.0 sec  6.55 MBytes  5.48 Mbits/sec
iperf -w1M -c 1.2.3.4
[  4] local 10.169.40.14 port 5001 connected with 1.2.3.4 port 55239
[  4]  0.0-18.3 sec   196 MBytes  89.6 Mbits/sec
The latter figure can vary significantly on subsequent tests, (Vagaries of AWS) but is usually between 70 and 130Mbit/s which is more than enough for our needs. Wiresharking the session, I can see:
iperf -cWindows SYN - Window 64kb, Scale 1 - Linux SYN, ACK: Window 14kb, Scale: 9 (*512)
iperf -c -w1MWindows SYN - Windows 64kb, Scale 1 - Linux SYN, ACK: Window 14kb, Scale: 9
Clearly the link can sustain this high throughput, but I have to explicity set the window size to make any use of it, which most real world applications won't let me do. The TCP handshakes use the same starting points in each case, but the forced one scales
Conversely, from a Linux client on the same network a straight, iperf -c (using the system default 85kb) gives me:
[  5] local 10.169.40.14 port 5001 connected with 1.2.3.4 port 33263
[  5]  0.0-10.8 sec   142 MBytes   110 Mbits/sec
Without any forcing, it scales as expected. This can't be something in the intervening hops or our local switches/routers and seems to affect Windows 7 and 8 clients alike. I've read lots of guides on auto-tuning, but these are typically about disabling scaling altogether to work around bad terrible home networking kit.
Can anyone tell me what's happening here and give me a way of fixing it? (Preferably something I can stick in to the registry via GPO.)
Notes
The AWS Linux instance in question has the following kernel settings applied in sysctl.conf:
net.core.rmem_max = 16777216
net.core.wmem_max = 16777216
net.core.rmem_default = 1048576
net.core.wmem_default = 1048576
net.ipv4.tcp_rmem = 4096 1048576 16777216
net.ipv4.tcp_wmem = 4096 1048576 16777216
I've used dd if=/dev/zero | nc redirecting to /dev/null at the server end to rule out iperf and remove any other possible bottlenecks, but the results are much the same. Tests with ncftp (Cygwin, Native Windows, Linux) scale in much the same way as the above iperf tests on their respective platforms.
Edit
I've spotted another consistent thing in here that might be relevant:

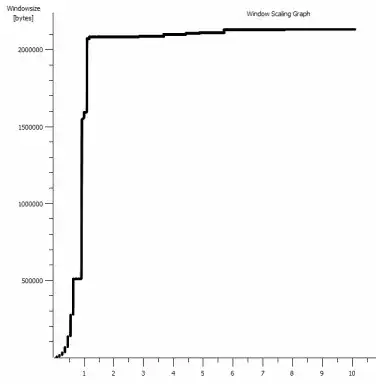
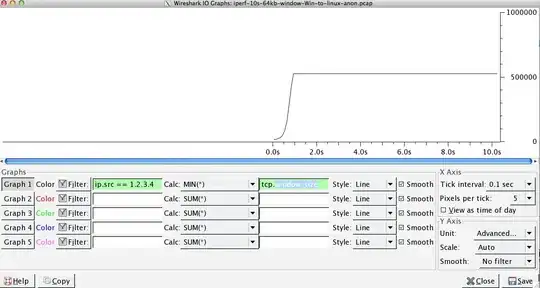
This is the first second of the 1MB capture, zoomed in. You can see Slow Start in action as the window scales up and the buffer gets bigger. There's then this tiny plateau of ~0.2s exactly at the point that the default window iperf test flattens out forever. This one of course scales to much dizzier heights, but it's curious that there's this pause in the scaling (Values are 1022bytes * 512 = 523264) before it does so.
Update - June 30th.
Following up on the various responses:
- Enabling CTCP - This makes no difference; window scaling is identical. (If I understand this correctly, this setting increases the rate at which the congestion window is enlarged rather than the maximum size it can reach)
- Enabling TCP timestamps. - No change here either.
- Nagle's algorithm - That makes sense and at least it means I can probably ignore that particular blips in the graph as any indication of the problem.
- pcap files: Zip file available here: https://www.dropbox.com/s/104qdysmk01lnf6/iperf-pcaps-10s-Win%2BLinux-2014-06-30.zip (Anonymised with bittwiste, extracts to ~150MB as there's one from each OS client for comparison)
Update 2 - June 30th
O, so following op on Kyle suggestion, I've enabled ctcp and disabled chimney offloading: TCP Global Parameters
----------------------------------------------
Receive-Side Scaling State          : enabled
Chimney Offload State               : disabled
NetDMA State                        : enabled
Direct Cache Acess (DCA)            : disabled
Receive Window Auto-Tuning Level    : normal
Add-On Congestion Control Provider  : ctcp
ECN Capability                      : disabled
RFC 1323 Timestamps                 : enabled
Initial RTO                         : 3000
Non Sack Rtt Resiliency             : disabled
But sadly, no change in the throughput.
I do have a cause/effect question here, though: The graphs are of the RWIN value set in the server's ACKs to the client. With Windows clients, am I right in thinking that Linux isn't scaling this value beyond that low point because the client's limited CWIN prevents even that buffer from being filled? Could there be some other reason that Linux is artificially limiting the RWIN?
Note: I've tried turning on ECN for the hell of it; but no change, there.
Update 3 - June 31st.
No change following disabling heuristics and RWIN autotuning. Have updated the Intel network drivers to the latest (12.10.28.0) with software that exposes functioanlity tweaks viadevice manager tabs. The card is an 82579V Chipset on-board NIC - (I'm going to do some more testing from clients with realtek or other vendors)
Focusing on the NIC for a moment, I've tried the following (Mostly just ruling out unlikely culprits):
- Increase receive buffers to 2k from 256 and transmit buffers to 2k from 512 (Both now at maximum) - No change
- Disabled all IP/TCP/UDP checksum offloading. - No change.
- Disabled Large Send Offload - Nada.
- Turned off IPv6, QoS scheduling - Nowt.
Update 3 - July 3rd
Trying to eliminate the Linux server side, I started up a Server 2012R2 instance and repeated the tests using iperf (cygwin binary) and NTttcp.
With iperf, I had to explicitly specify -w1m on both sides before the connection would scale beyond ~5Mbit/s. (Incidentally, I could be checked and the BDP of ~5Mbits at 91ms latency is almost precisely 64kb. Spot the limit...)
The ntttcp binaries showed now such limitation. Using ntttcpr -m 1,0,1.2.3.5 on the server and ntttcp -s -m 1,0,1.2.3.5 -t 10 on the client, I can see much better throughput:
Copyright Version 5.28
Network activity progressing...


Thread  Time(s) Throughput(KB/s) Avg B / Compl
======  ======= ================ =============
     0    9.990         8155.355     65536.000

#####  Totals:  #####

   Bytes(MEG)    realtime(s) Avg Frame Size Throughput(MB/s)
================ =========== ============== ================
       79.562500      10.001       1442.556            7.955

Throughput(Buffers/s) Cycles/Byte       Buffers
===================== =========== =============
              127.287     308.256      1273.000

DPCs(count/s) Pkts(num/DPC)   Intr(count/s) Pkts(num/intr)
============= ============= =============== ==============
     1868.713         0.785        9336.366          0.157

Packets Sent Packets Received Retransmits Errors Avg. CPU %
============ ================ =========== ====== ==========
       57833            14664           0      0      9.476
8MB/s puts it up at the levels I was getting with explicitly large windows in iperf. Oddly, though, 80MB in 1273 buffers = a 64kB buffer again. A further wireshark shows a good, variable RWIN coming back from the server (Scale factor 256) that the client seems to fulfil; so perhaps ntttcp is misreporting the send window.
Update 4 - July 3rd
At @karyhead's request, I've done some more testing and generated a few more captures, here: https://www.dropbox.com/s/dtlvy1vi46x75it/iperf%2Bntttcp%2Bftp-pcaps-2014-07-03.zip
- Two more
iperfs, both from Windows to the same Linux server as before (1.2.3.4): One with a 128k Socket size and default 64k window (restricts to ~5Mbit/s again) and one with a 1MB send window and default 8kb socket size. (scales higher) - One
ntttcptrace from the same Windows client to a Server 2012R2 EC2 instance (1.2.3.5). here, the throughput scales well. Note: NTttcp does something odd on port 6001 before it opens the test connection. Not sure what's happening there. - One FTP data trace, uploading 20MB of
/dev/urandomto a near identical linux host (1.2.3.6) using Cygwinncftp. Again the limit is there. The pattern is much the same using Windows Filezilla.
Changing the iperf buffer length does make the expected difference to the time sequence graph (much more vertical sections), but the actual throughput is unchanged.

