9

Yesterday the CPU on my Xen-based VPS server went to 100% for two hours and then went back to normal, seemingly naturally.
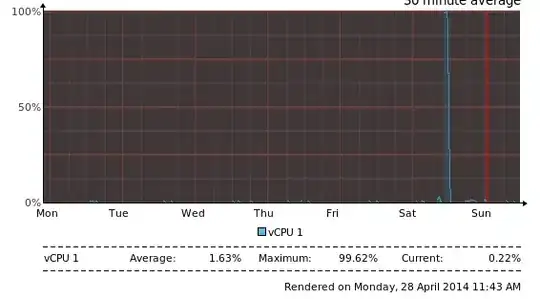
I have checked logs including syslog, auth.log and more and nothing seems out of the ordinary.

  • During this time, the server seemed to be operating as normal as indicated by people logging in, emails received etc
  • Memory, disk and network usage during this time appeared to be normal.
  • I hadn't rebooted the server in weeks, and I wasn't working on it that morning.
  • I keep it updated with security updates and the like. It's 12.04 LTS.
  • It runs nginx, mysql and postfix along with a few other things.

Around the start of the event syslog contains these entries:

Apr 27 07:55:34 ace kernel: [3791215.833595] [UFW LIMIT BLOCK] IN=eth0 OUT= MAC=___ SRC=209.126.230.73
 DST=___ LEN=40 TOS=0x00 PREC=0x00 TTL=244 ID=2962 PROTO=TCP SPT=49299 DPT=465 WINDOW=1024 RES=0x00 SYN URGP=0
Apr 27 07:55:34 ace dovecot: pop3-login: Disconnected (no auth attempts): rip=209.126.230.73, lip=___
Apr 27 07:55:34 ace kernel: [3791216.012828] [UFW LIMIT BLOCK] IN=eth0 OUT= MAC=___ SRC=209.126.230.73
 DST=___ LEN=40 TOS=0x00 PREC=0x00 TTL=244 ID=58312 PROTO=TCP SPT=49299 DPT=25 WINDOW=1024 RES=0x00 SYN URGP=0
Apr 27 07:55:34 ace kernel: [3791216.133155] [UFW LIMIT BLOCK] IN=eth0 OUT= MAC=___ SRC=209.126.230.73
 DST=___ LEN=76 TOS=0x00 PREC=0x00 TTL=244 ID=63315 PROTO=UDP SPT=49299 DPT=123 LEN=56

But then again, I get these all the time. It just indicates UFW/iptables successfully blocked some unwanted connections. It shouldn't be related.

I have a daily backup that runs just under 2 hours prior to the start of this "event". It seemed to run normally although it did cause a higher server load (but not CPU utilisation) than normal, pointing to a possible I/O congestion issue. But it didn't coincide with the 100% CPU event.

My question is: how can I investigate the cause of an event like this that happened in the past, given that it's no longer happening?

thomasrutter
  • 2,437
  • 1
  • 25
  • 34
  • 1
    Do you have any sort of monitoring system or is that graph just from the VPS provider? Looking at disk and memory usage for that timeframe may be helpful. – Grant Apr 28 '14 at 02:11
  • Disk and memory usage were normal/unaffected during that time as shown in other charts (not pictured). The charts are compiled by a script that runs every 5 minutes installed on the VPS by default by the VPS provider. They report CPU, memory, disk and network usage every 5 minutes. The CPU is the only one that shows an anomaly. I have a daily backup that runs a couple of hours prior to the start of this "event". It seemed to run normally although it did cause a higher server load (but not CPU utilisation) than normal, pointing to a possible I/O congestion issue. – thomasrutter Apr 28 '14 at 02:23
  • I've added some more info to the question. – thomasrutter Apr 28 '14 at 02:26
  • If there is nothing in the logs, your best bet may be to have a cron job dump the output of ps to a file every 5 minutes and wait for it to happen again. Then you will have a record of what was running at the time. – Grant Apr 28 '14 at 02:34
  • It's unlikely to happen again, at least in a reasonable time frame that would allow some closure. It didn't happen for about a year of that server running that configuration, and so far hasn't happened since. I was hoping to get some advice on to what extent it's possible to investigate something that happened in the past. Have I done all that's possible? – thomasrutter Apr 28 '14 at 02:45
  • 3
    It might be that the provider over committed their physical environment... – MohyedeenN Apr 28 '14 at 05:39
  • BSD process accounting, if you have it, can be helpful in such cases. It must be enabled in the kernel and you must install the userspace tools. – András Korn Sep 01 '14 at 15:23

1 Answers1

1

If you have CPU load graphs available, they might give further insight into what the CPU was doing at this time. It could have been waiting for disk IO's for instance, this is called IOWAIT.

If these are not available and you're having difficulty finding a reason this incident could very well be attributed to issues on the host server. Perhaps an issue with a noisy neighbor: a VM on the same host that is misbehaving, or a hardware failure (like a disk, this could cause high IOWAIT).

There is a utility called atop, this will keep a detailed record of your processes and would have shown the answer here. atop will make a 'snapshot' of all your process and resource usage every xx minutes (configurable). This is not going to help you now, but will if this were to happen again. See the atop website for more information: https://www.atoptool.nl/

P.s. Ubuntu 12.04 has reached end of life status and you should consider upgrading the machine since no more security updates are available for this version. See the Ubuntu release cycle: https://ubuntu.com/about/release-cycle