4

We have a load balanced server farm using Tomcat 7. Once in a while (once a day, at least) a server's CPU load spikes way up. This appears to be legitimate server usage and not a fault, but I can't figure out how to identify what particular site usage is causing these CPU spikes.

Here are the tools we are using:

  • Javamelody, which shows long-running calls but not when they happened.
  • Zabbix, which shows CPU usage but not what's causing it.
  • The server logs, which, by management directive, only show the threads but not any statistics.

Is there some way to tie these together and find out what threads were running at the time of the spike?

Or is there a better tool we need to use?
ewwhite
  • 194,921
  • 91
  • 434
  • 799
user1071914
  • 183
  • 1
  • 3
  • 10

3 Answers3

2

Java Flight Recorder and Java Mission Control is worth a try if Oracle Hotspot Jdk 1.7u40+ runs Tomcat. Remember, you must run the JVM with the JVM argument -XX:+UnlockCommercialFeatures and provide JMX support to be able to connect to the Java process with JMC.

David Lakatos
  • 303
  • 1
  • 10
1

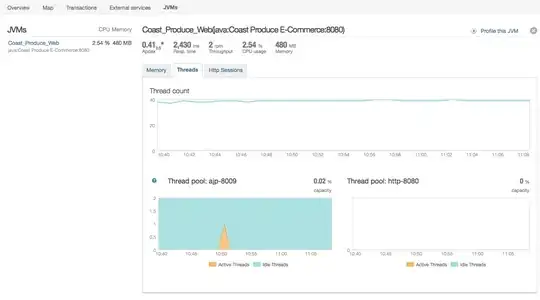
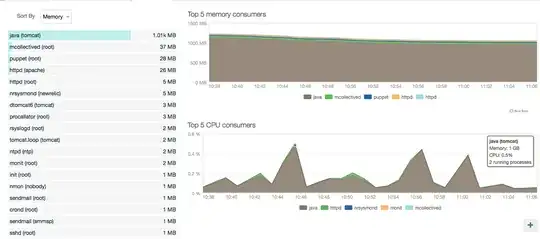
If this is reproducible or at least occurs daily, run NewRelic for a day (free tier) and try to capture this at the OS level... or integrate it into the application and obtain the detailed statistics. Very handy tool for something like this.


enter image description here

enter image description here

Edit:

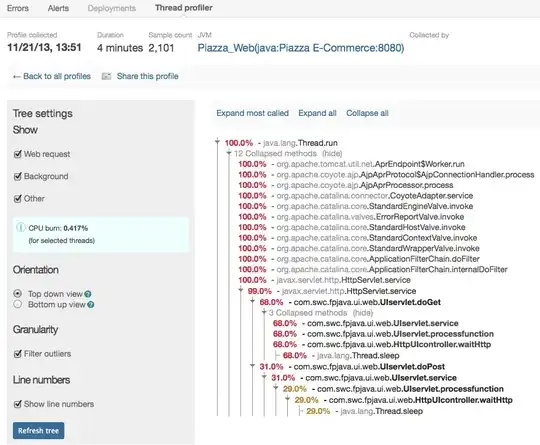
Profiling is an option as well...

enter image description here

ewwhite
  • 194,921
  • 91
  • 434
  • 799
  • Unfortunately we get stats like that already from Javamelody, but it does not drill down to be specific enough. I need something that will provide me, ideally, the actual line of our code that was executing during these spikes. Something that will enable me to say "this was a customer looking up product X at 10:57 AM and it took 794 seconds". Unless I misunderstood the New Relic site, their product gives server-level and process-level stats (which are great, but not what I need.) – user1071914 Mar 24 '14 at 16:32
  • New Relic can profile as well. – ewwhite Mar 24 '14 at 16:37
1

We use a tool called psi-probe. It's more of a look at live data as opposed to looking back on a problem that occurred earlier. But it gives statistics for all your different webapps including connections, threads, traffic, etc.. It's decent for a free tool.

https://code.google.com/p/psi-probe/

Safado
  • 4,726
  • 7
  • 35
  • 53