I have server with FreeBSD (16 cores with HT, SSD, 32Gb RAM) which is getting about 40M http requests daily. All requests are served by nginx + php-fpm.
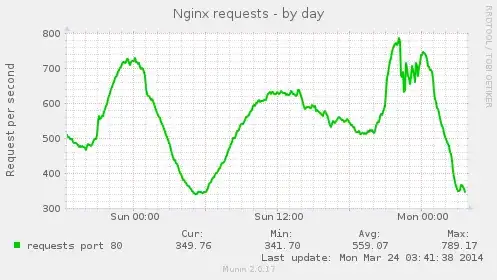
At these graphs you see that we have a problems during traffic peak. I'm not sysadmin, please explain me what is "Active connections", "Writing", "Waiting", "Reading" and why "Writing" increases when server is unable to serve requests quickly?
Here are some more graphs with CPU,memory and Load Average.
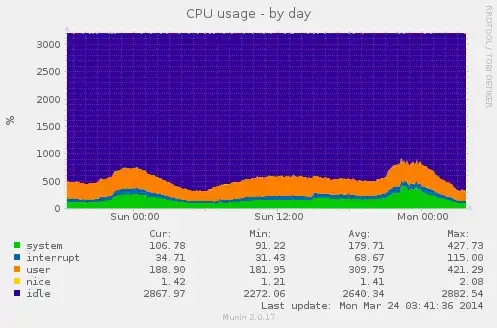
As you can see, nothing strange happens with CPU and memory, but Load Average also have a peak.
During this Load Average peak, I've noticed that there is a unserved queue on php-fpm.sock
netstat -Lan | grep php-fpm
unix  2525/0/32246      /tmp/php-fpm.sock
Number of members in queue is varying from 0 to 12000. When value is 0 - everything is fine and I'm getting http response in 60-100ms. When value is 5000-12000 is can take up to 3-10 seconds.
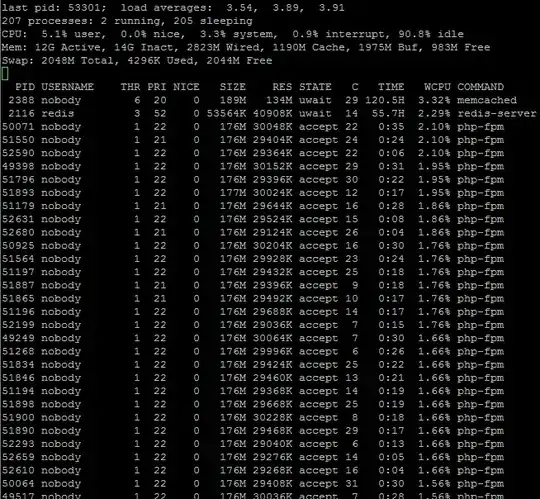
I've also checked if ther any unusual processes in top, but was unable to find anything.
Here is the top screenshot taken some minutes ago (right now everything is ok, no traffic peak):
My conclusion: according to CPU and memory graphs I can say that this server can serve more and more requests, but because of non-optimal work of php-fpm it is impossible during traffic peaks.
Any suggestions about how can this problem be solved?