Does anyone know of a bash or similar script that will pull stats from a Linux server and display them on a centralized web page or send a report via email every "x" hours?
I've found services that offer something close but they are cost prohibitive and missing some of the stats I'd want and some functions just don't work, etc.
The idea would be to pull:
- CPU load
- RAM and SWAP
- Disk used / free
- TX and RX for a given time period (year to date, month, week and day)
- Active processes
- IPs attempting login (failures from secure log on my CentOS boxes)
I'd like to pull the reports to a central server and display them on a web page but having the reports emailed on a timed basis would be better than nothing.
- 99
- 1
- 8
-
The closest solution I've found so far is: http://servermonitoringhq.com. It uses a simple bash script and cron job on each server and pulls the stats to their hosted web UI. I like it but would prefer something we host ourselves and something we can edit the bash script to use commands or apps we prefer. The hosted solution is not too bad cost wise but a bit more than practical and not all the monitoring commands work (such as the TX / RX monitor). – linux911 Jan 19 '14 at 06:32
6 Answers
Another software you could use is munin. You can do everything you want with munin but for some parts it needs some complex configuration. We have munin running for several years and are very happy with it.
- 2,011
- 2
- 17
- 26
-
Hi, user241. Welcome to ServerFault. It's okay to link to product web pages, but ServerFault generally prefers that answers include more than just a link because of potential linkrot (and also because a simple link looks spammy). Do you have any experience with the product in question, especially as it relates to the OP's question and his/her needs? – Katherine Villyard Jan 18 '14 at 18:35
-
The free trial of that product is not a viable option for 2 dozen servers. We have tried them and it's more suitable for monitoring application development servers, IMO. Plus, they really don't provide a "free" option, they will constantly contact you trying to sell you on the paid version which is too expensive for this usage scenario. – linux911 Jan 18 '14 at 18:39
-
Yeah signing up will give you free trial but what I'm talking about is the free server monitoring part which is essentially free. BTW, we have more than 2 dozen servers being monitored at the moment. – user241 Jan 18 '14 at 19:13
-
I think New Relic is among solutions selected in community advertisements at StackExchange. – mveroone Jan 18 '14 at 23:48
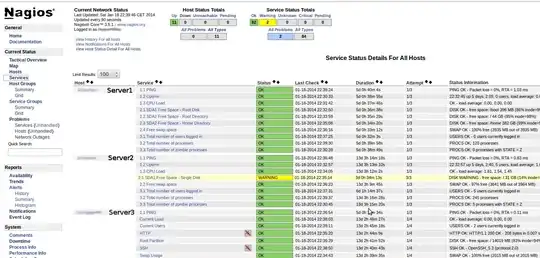
Nagios is an open source project that should do 90% of what you're looking for in your list of requirements. Like most monitoring tools Nagios uses ICMP and SNMP to monitor remote systems, however, it also has an add-on called the Nagios Remote Plugin Executor (NRPE). NRPE is essentially an agent running on the machine you want to monitor; from the Nagios monitoring system you issue commands to the NRPE process on the monitored system and feedback is presented thorugh the Nagios web interface. I use NRPE to monitor everything in your requirements list but the CentOS failed logins; for this I use OSSEC.
Nagios screenshot:

OSSEC is an open source project that I would consider for watching your secure log on the CentOS machines. This tool is an agent/server based architecture that can monitor your Windows or Linux systems for a variety security related events, to include failed logins. The functionality goes beyond log monitoring though, check out the file and registry integrity checking, anomaly detection, reporting and active response.
It will take some time to learn these two tools but I believe it will be time well spent. Both projects have been around for years and will remain for years to come.
- 11
- 1
-
We've used Cacti and Nagios in the past. We ran into problems with our routers reacting to 5 minute SNMP cycles like they were a DOS attack, even to the point of locking up on occasion. – linux911 Jan 19 '14 at 06:29
-
Tools in this category take planning and tuning, regardless of the size of your organization or the price of the tool. The default five minute polling cycle that might be in a Nagios template is configurable, as would be the NRPE probes against the servers in your question, or any other parameter for that matter. If the only reason your not using Nagios or Cacti is because it DOS'd your routers, I'd recommend you give it another go and ask questions at severfault and Stack Exchange along the way. Best of luck. – packetloss Jan 19 '14 at 09:11
Most monitoring tools can do this. Either by pulling the values via snmp or with ab agent that will collect that data.
- 7,657
- 3
- 31
- 71
Building something custom out of mrtg is a common practice, although kind of handwork. OVH has built something like that for their dedicated servers. See : ftp://ftp.ovh.net/made-in-ovh/mrtg-sys
Most small-to-medium companies will use Nagios with Centreon or any other kind of consolidation tool. Also see Canopsis for building Hypervision over supervised servers
- 447
- 7
- 22