2

We are running CentOS 6 with a PHP web application.

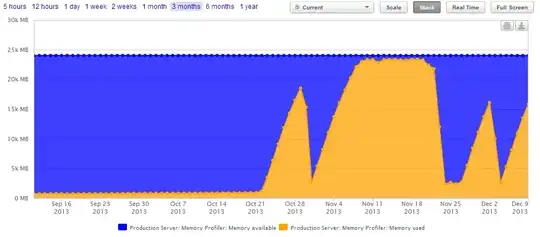
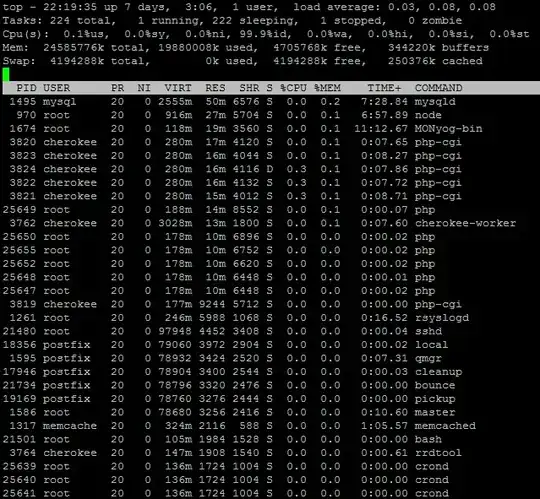
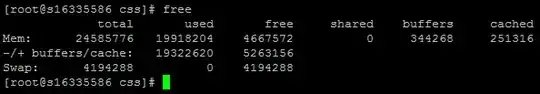
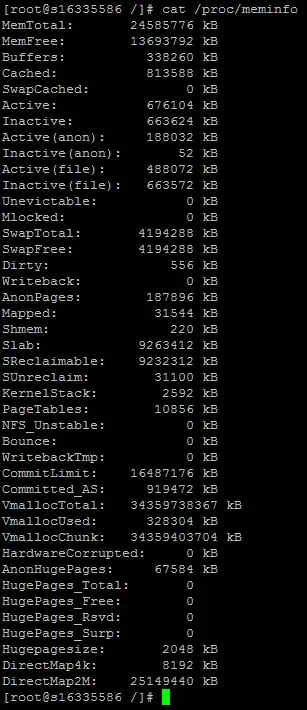
After we pushed a new version live it seems we have a memory issue, however top does not show any high usage instances. I have looked around and people suggest checking out free, to check if it is just being used by the cache. The result shows that it is being used up by processes other than cache.

scout.io top free meminfo

I would like to know which direction to start looking in, and any suggestions if there are any.

Many Thanks - Matt

  • 4
    Do you have an actual problem or is this issue purely cosmetic? – David Schwartz Dec 10 '13 at 00:03
  • 1
    What is the output of `ps -eo rss,vsz,pid,cmd --sort -rss,-vsz` – sciurus Dec 10 '13 at 00:09
  • 2
    In addition to the information @sciurus requested, you need to ask yourself "What changed on or about October 21?" (You say you pushed a "new version" of your code -- what did the developers *do*? Do their changes explain this behavior? Is this an expected consequence, or a bug that needs to be fixed? If it's an expected consequence, will you need to adjust your capacity planning based on the new version of the code?) – voretaq7 Dec 10 '13 at 00:22
  • Provide the output of `cat /proc/meminfo` – Matthew Ife Dec 10 '13 at 01:17
  • @DavidSchwartz Yes, the server also runs other websites, and it seems this problem causes assets to timeout when requesting (images, scripts etc) – Matt Votsikas McLean Dec 13 '13 at 14:13

1 Answers1

2

You should have the developers test their code (specifically the code that changed in this new version) and measure the memory usage. Tools like the xdebug profiler (you can use webgrind, phpstorm, qcachegrind/kcachegrind to read the results) and (maybe more importantly) xhprof, as it also collects memory metrics. You can use tools like preinheimer/xhprof or perftools/xhgui to visualize that data.