I have a EC2 m1.large Ubuntu 13.04 Instance runs PHP 5.5, PHP-FPM and NGINX. Cache is handled by Elastic Cache using Redis and the database connects to a separate m1.large MongoDB server. The content can be fairly dynamic as newsfeed can be dynamic and my server is used by an iOS app.
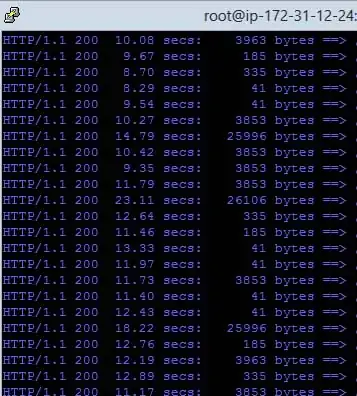
I am doing siege tests siege -d5 -c150 if I do only 1 siege I see responses times that are less than 1 sec. If I add another server to do another siege -d5 -c150 my response times go up the roof to 9-15 sec`
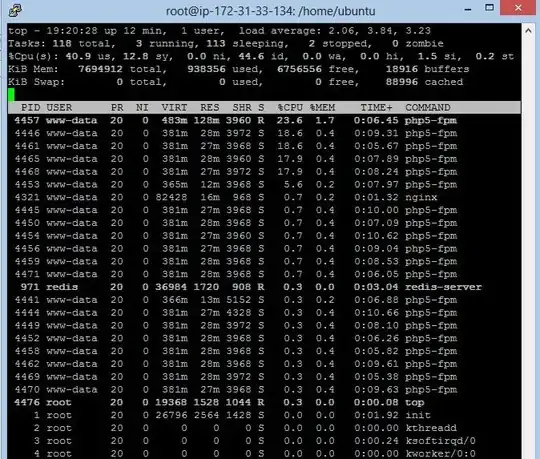
I am very new to servers setups but somethings tells me that if my server is always average of 40-50% CPU load and consuming under 1GB of ram. I shouldn't see 10++ sec latency having so much free resources?
What could be my bottle neck or even better how could I find it??


/etc/sysctl.conf are
 net.ipv4.tcp_fin_timeout = 30
net.ipv4.tcp_tw_recycle = 1
net.ipv4.tcp_tw_reuse = 0
net.ipv4.ip_local_port_range = 2000 65000
net.ipv4.tcp_no_metrics_save = 1
net.ipv4.tcp_window_scaling = 1
net.ipv4.tcp_max_syn_backlog = 3240000
net.core.somaxconn = 3240000
net.ipv4.tcp_max_tw_buckets = 1440000
kernel.shmmax = 1073741824
net.ipv4.tcp_rmem = 4096 25165824 25165824
net.core.rmem_max = 25165824
net.core.rmem_default = 25165824
net.ipv4.tcp_wmem = 4096 65536 25165824
net.core.wmem_max = 25165824
net.core.wmem_default = 65536
net.core.optmem_max = 25165824
net.ipv4.tcp_mem = 1474560    1966080    2949120
/etc/php5/fpm/pool.d/www.conf
pm = dynamic
pm.max_children = 32
pm.start_servers = 3
pm.min_spare_servers = 2
pm.max_spare_servers = 5
pm.max_requests = 150
/etc/nginx/nginx.conf
user www-data;
worker_processes 4;
pid /run/nginx.pid;

events {
    worker_connections 32768;
    multi_accept on;
    use epoll;
}

http {

    include       /etc/nginx/mime.types;
    default_type application/octet-stream;

    sendfile on;
    tcp_nopush on;
    tcp_nodelay on;
    keepalive_timeout 15;

    server_tokens off;

    # allow the server to close the connection after a client stops responding. Frees up socket-associated memory.
    reset_timedout_connection on;


    # send the client a "request timed out" if the body is not loaded by this time. Default 60.
    client_body_timeout 10;

    # If the client stops reading data, free up the stale client connection after this much time. Default 60.
    send_timeout 10;

    ##
    # Logging Settings
    ##

    access_log /var/log/nginx/access.log;
    error_log /var/log/nginx/error.log;

    ##
    # Gzip Settings
    ##

    gzip on;
    gzip_disable "MSIE [1-6]";

    ##
    # Virtual Host Configs
    ##

    include /etc/nginx/conf.d/*.conf;
    include /etc/nginx/sites-enabled/*;
    server {
        listen 80 default;
        root /var/www/;
        index index.php index.htm index.html;

        # php-fpm bridge
        # execute all .php files with php-fpm
           location ~ .php$ {
              fastcgi_pass   unix:/var/run/php5-fpm.sock;
              fastcgi_index  index.php;
              fastcgi_param  SCRIPT_FILENAME $document_root$fastcgi_script_name;
              fastcgi_buffer_size 128k;
              fastcgi_buffers 256  16k;
              fastcgi_busy_buffers_size 256k;
              fastcgi_temp_file_write_size 256k;
              include fastcgi_params;
           }
    }
}
siege results
ransactions:                    1265 hits
Availability:                  99.68 %
Elapsed time:                1196.10 secs
Data transferred:              21.30 MB
Response time:                 11.48 secs
Transaction rate:               1.06 trans/sec
Throughput:                     0.02 MB/sec
Concurrency:                   12.14
Successful transactions:        1265
Failed transactions:               4
Longest transaction:           26.88
Shortest transaction:           0.00