I have a custom script that is querying a metric port for an application that I'm running and submitting parsed values to ganglia via gmetric. The script runs every minute, so I submit the data to ganglia using the following gmetric options:
/usr/sbin/gmetric -g ec2 -s positive -t uint32 -d 600 -n "$NAME" -v $VALUE -x 60
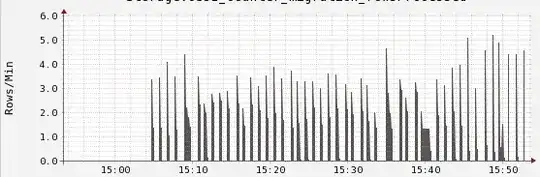
But for some reason there are still gaps in the graphing data:
Is there something in my formatting that is preventing the dmax/ttl of the last metric received from being honored? Is there anyone who does custom metric collection that has run into this problem before that can shed some insight or provide some tips as to how to best correct this?