6

I would like to measure the read and write performance of a RAID6 array verses a RAID10 array. I understand that bonnie++ can be used to calculate disk performance, but the numbers produced by bonnie++ don't include terms like 'IOPS'. These days, many of the disk performance articles and howtos mention 'IOPS'.

How can I use bonnie++ to calculate the IOPS of a disk array. How can I ensure that my tests are testing the actual I/O of the disks and not the system cache?

Here are some sample statistics from one of my servers. Will one of these fields report a number similar to IOPS?

# bonnie++ -q -d /data -u root
Version  1.96       ------Sequential Output------ --Sequential Input- --Random-
Concurrency   1     -Per Chr- --Block-- -Rewrite- -Per Chr- --Block-- --Seeks--
Machine        Size K/sec %CP K/sec %CP K/sec %CP K/sec %CP K/sec %CP  /sec %CP
hosta.example. 11680M   680  99 281780  26 133389  18  3955  99 382518  24  1097  31
Latency             12070us     124ms     406ms    8065us   60074us   36903us
Version  1.96       ------Sequential Create------ --------Random Create--------
hosta.example.org     -Create-- --Read--- -Delete-- -Create-- --Read--- -Delete--
              files  /sec %CP  /sec %CP  /sec %CP  /sec %CP  /sec %CP  /sec %CP
                 16 25616  33 +++++ +++ +++++ +++ +++++ +++ +++++ +++ +++++ +++
Latency               125us     637us     585us     100us      13us      41us
1.96,1.96,hosta.example.org,1,1371669888,11680M,,680,99,281780,26,133389,18,3955,99,382518,24,1097,31,16,,,,,25616,33,+++++,+++,+++++,+++,+++++,+++,+++++,+++,+++++,+++,12070us,124ms,406ms,8065us,60074us,36903us,125us,637us,585us,100us,13us,41us
Stefan Lasiewski
  • 22,949
  • 38
  • 129
  • 184

1 Answers1

6

Different tools display this information in different ways. The terminology isn't consistent.

I don't think you should use bonnie++ alone to determine IOPS. Or if you do choose to use it (or another tool like iozone), you can meter the activity with any number of utilities to capture I/O operations-per-second.

So I may run bonnie++ -d /data -u root -n 64:100000:16:64, and while that's in progress, I'll use one of the following methods to trace I/O activity:

P.S. By default, bonnie++ will use file sizes twice as large as the amount of installed RAM to limit/eliminate the caching effect.

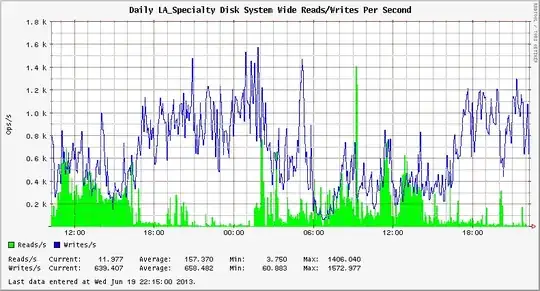
...or you can graph it...

I use orca for this purpose.

This system averages 816 combined read/write IOPS. enter image description here


Examples:

iostat - look for tps

[root@Brazzers1 ~]# iostat cciss/c0d0 1
Linux 2.6.18-348.2.1.el5 (Brazzers1)         06/19/13

avg-cpu:  %user   %nice %system %iowait  %steal   %idle
           8.61    2.74   11.17    0.56    0.00   76.92

Device:            tps   Blk_read/s   Blk_wrtn/s   Blk_read   Blk_wrtn
cciss/c0d0     2774.00        48.00    113297.00         48     113297

collectl - look for IOs. Split into read and write. The sum equals IOPS.

[root@Brazzers2 ~]# collectl -sD
waiting for 1 second sample...

# DISK STATISTICS (/sec)
#          <---------reads---------><---------writes---------><--------averages--------> Pct
#Name       KBytes Merged  IOs Size  KBytes Merged  IOs Size  RWSize  QLen  Wait SvcTim Util
c0d0           300      0   64    5    4732     83  293   16      14     1     1      0   35
c0d0            20      0    5    4    3397     39  344   10       9     5     1      0    6
c0d0             3      0    1    4    2256      8  267    8       8    11     1      0    3
c0d0             4      0    1    4    4283      3  499    9       8    11     1      0    7
c0d0             0      0    0    0    1692     49  133   13      12     2     0      0    2
c0d0             8      0    2    4    6689     17  710    9       9    18     1      0    7
c0d0             0      0    0    0    1246     13  187    7       6    22     0      0    0
c0d0            16      0    3    5    3870      7  247   16      15     3     0      0    7
c0d0            31      0    8    4    3149     40  195   16      15     1     0      0    7
c0d0            28      0    6    5    1883     20  250    8       7     4     1      0    6
c0d0             8      0    2    4    1872     59  137   14      13     1     0      0    6
c0d0             4      0    1    4    4582     45  681    7       6    23     1      0    5
c0d0            52      0   13    4    2621     10  182   14      13     1     0      0   12
c0d0             0      0    0    0    2613     14  324    8       8     7     1      0    4
c0d0             7      0    2    4    1983      9  223    9       8     2     0      0   10
c0d0             8      0    2    4    1709     30  215    8       7     6     0      0    2
c0d0             4      0    1    4    4102     17  253   16      16     2     1      0   15
c0d0            12      0    3    4    4415     20  500    9       8     7     1      0   11
c0d0             4      0    1    4    3261     21  449    7       7    10     1      0    7
c0d0             3      0    1    4   12639      3  640   20      19     2     0      0    8
c0d0            28      0    7    4   42023      8 1839   23      22     1     0      0   15
c0d0             4      0    1    4   28384      6 1401   20      20     2     0      0   12

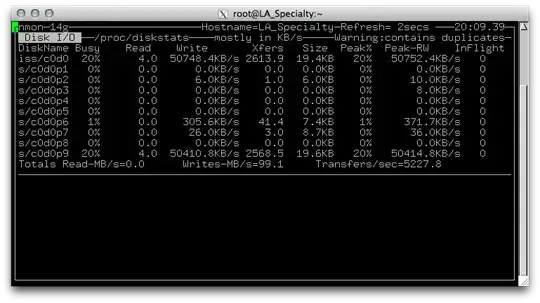
nmon - Look for Xfers.

enter image description here

ewwhite
  • 194,921
  • 91
  • 434
  • 799
  • Thanks for the pointers! I am using Bonnie++ at the recommendation of some Splunk documentation, but it did seem that their docs were missing something. http://wiki.splunk.com/Community:HardwareTuningFactors#Disk – Stefan Lasiewski Jun 20 '13 at 23:43
  • @StefanLasiewski Yesh, that's pretty incomplete. There are a number of good methods to improve I/O performance. It extends beyond the scope of this question, though. – ewwhite Jun 20 '13 at 23:48
  • To your knowledge, does using `bonnie++` have any advantages over simply writing large files using `dd`? – Stefan Lasiewski Jun 21 '13 at 00:02
  • 1
    Yes, because it's not all about sequential reads/writes. Most I/O is a mix of random reads/writes. That's important to measure. – ewwhite Jun 21 '13 at 00:03
  • So according to the stats above, you're getting over 2600 IOPS? I just want to make sure that I understand what the tools are telling me, since 2600 IOPS is requires many 15K spindles. (or an SSD something). – Stefan Lasiewski Jun 21 '13 at 18:51
  • @StefanLasiewski Yes, that is correct... and that's with 6 x 15k 600GB SAS in RAID 1+0 drives and a solid 1GB cache on the array. – ewwhite Jun 21 '13 at 18:54