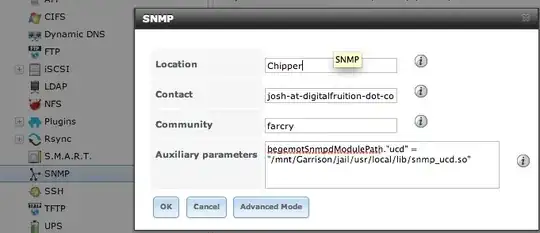
I have two servers which run variants of FreeBSD: One is a pfSense router and one is a FreeNAS 8 server. Both these servers run SNMP, and I am collecting and graphing their information using a third Cacti server.
The SNMP data from both the pfSense server and the FreeNAS server does not include memory usage, CPU usage, nor Load Average.
The traffic graphs for the pfSense server look fine. The disk usage reports from the FreeNAS server look beautiful. I just don't get any data for memory usage, CPU usage, nor Load Average. I know both these servers should be capable of providing this data, because in the pfSense and freeNAS web admins I can view graphs. But I would prefer to have all the graphs in Cacti for ease of management.
How can I get my pfSense server to provide memory usage, CPU usage, and Load Average data via SNMP? How can I get my FreeNAS server to provide memory usage, CPU usage, and Load Average data via SNMP? I assume the same procedure will work for both servers.
