4

I am not sure how to interpret the memory usage of our servers on which WebSphere MQ (WMQ) is running. The main question is: Is WMQ using more and more memory over time (is it leaking memory) or is everything just fine and Linux is using our RAM for disk caching?

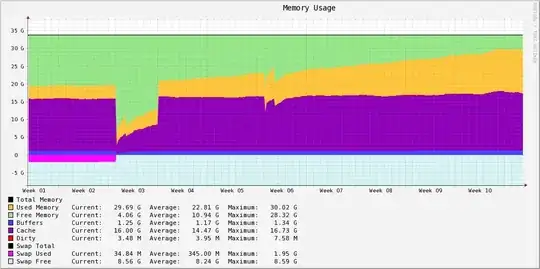
We have the following Cacti graph.

The data for this is polled from /proc/meminfo. Which currently shows the following output.

[user@server ~]$ cat /proc/meminfo 
MemTotal:     32956188 kB
MemFree:       3963664 kB
Buffers:       1225024 kB
Cached:       15611124 kB
SwapCached:      34016 kB
Active:       23880484 kB
Inactive:      3279676 kB
HighTotal:           0 kB
HighFree:            0 kB
LowTotal:     32956188 kB
LowFree:       3963664 kB
SwapTotal:     8388600 kB
SwapFree:      8354584 kB
Dirty:            1648 kB
Writeback:           0 kB
AnonPages:    10290180 kB
Mapped:         457704 kB
Slab:          1375028 kB
PageTables:     136452 kB
NFS_Unstable:        0 kB
Bounce:              0 kB
CommitLimit:  24866692 kB
Committed_AS: 19962412 kB
VmallocTotal: 34359738367 kB
VmallocUsed:    382196 kB
VmallocChunk: 34359356007 kB
HugePages_Total:     0
HugePages_Free:      0
HugePages_Rsvd:      0
Hugepagesize:     2048 kB

The command free -m shows the following currently.

[user@server ~]$ free -m 
             total       used       free     shared    buffers     cached
Mem:         32183      28312       3871          0       1196      15245
-/+ buffers/cache:      11870      20313
Swap:         8191         33       8158

According to the web site "linuxatemyram dot com" only the line "-/+ buffers/cache: 11870 20313" of "free -m" is relevant.

In the Cacti graph you can clearly see that "Used Memory" is increasing since the beginning of "Week 03". On the other hand "Cache" and "Buffers" seem to be pretty constant. How is "Used Memory" relevant in this case? Is WMQ leaking memory?

Michael Hampton
  • 237,123
  • 42
  • 477
  • 940
Tony Stark
  • 372
  • 1
  • 3
  • 17
  • _Plenty_ of free memory, nothing to worry about. If some data is loaded into memory, Linux will keep it around (it might be used again, and erasing it is active work...) – vonbrand Mar 12 '13 at 22:19
  • I just saw this post. Do you remember which cacti template you used for this graph ? Thank you – John Dimitriou Jul 18 '16 at 07:32

2 Answers2

2

Yes, something is consuming more and more memory. No, it's not the VFS (buffers and cache). It's not possible to draw any further conclusions from the data you've provided.

You really need to look at which processes / programs are using what memory - this provides a better indicator than just looking at the RSS / VSZ, but it can still be misled by COW pages. Try to get a series of snapshots and see if the change matches the change in your cacti graph.

symcbean
  • 19,931
  • 1
  • 29
  • 49
  • I am not sure I understand it correctly. Which source of information should I trust? The output of free -m is telling me that currently about 11.8GB of server memory is used and about 20.3GB is free. In the cacti graph I clearly see that currently 29GB of 34GB is displayed as "Used Memory". According to linuxatemyram.com only what is shown by free -m is relevant and the "Used Memory" is taken by Linux to optimize disk caching. – Tony Stark Mar 12 '13 at 16:26
  • Look at your graph again. Yes it's reporting 29.69G for used memory - and the graph shows the yellow area peaking at around that value - but between the yellow line and the axis there's a pruple and an blue line - i.e. the 29.69 figure is actually used+buffers+cache. – symcbean Mar 12 '13 at 16:37
  • What you are saying is correct, the 29.69 is used+buffers+cache but again according to linuxatemyram.com the yellow area is used memory that can still be used in any application. I am still not sure if this is really *used* because Linux might be taking it for speeding up the whole system and as soon as it is needed by the application Linux might be freeing it. – Tony Stark Mar 13 '13 at 08:18
  • No - only the buffers and cache are used by the OS for "speeding up the system" - that's the purple and blue bits - not the yellow. It's the yellow where your problem is - which is ONLY userspace programs, data and the kernel. – symcbean Mar 13 '13 at 09:23
1

You have ~20GB of RAM available to processes on that system. The OS will use free RAM to cache filesystem reads speed up subsequent reads of the same files. It's quite normal to see 'Used' RAM increasing slowly over time as more and more of the filesystem is accessed; you won't see any performance problems as a result of this and if a process needs to allocate this RAM later, then the OS will gladly relinquish it.

Edit

As @symcbean points out, something is slowly consuming more memory. If the server is given over to just this one application, then that's the first place to start looking, but I second that recommendation of the python script for getting a clearer picture of what's happening.

SmallClanger
  • 8,947
  • 1
  • 31
  • 45
  • `If your buffers line is mostly stable, then then you don't likely have a memory leak` do you mean the total memory used less buffers and cache or do you mean the size of the buffers? The graph clearly shows that the first is NOT the case. The second would be an absurd proposition. – symcbean Mar 12 '13 at 15:21
  • @symcbean You're right, I completely misread that graph and what the OP had said. I read that as a roughly flat allocation with increasing cache over time. It's actually roughly flat cache usage with increasing allocation over time. All other things being equal, that *would* indicate a slow memory leak, (Sorry Tony, I should refrain from chucking out answers while I'm distracted). I'll update my answer. – SmallClanger Mar 12 '13 at 15:54
  • Increasing memory usage by an application might just be in-application caches or other growing data structures, not really unreachable/unreclaimable memory (_that_ is a memory leak). Without any insight into the application memory use, all is just (more or less) wild guessing. – vonbrand Mar 12 '13 at 22:24