11

first time on ServerFault, and I've got a nice little conundrum.

Since a few months now, we've been having issues with our internet connectivity.

Environment:

Servers: 2 Terminal Servers as an RDSFarm running Windows Server 2008 R2
Browser: Internet Explorer 9
Test/debug browser: Chrome
AntiVirus: Avast 7.0.1455

Problem:

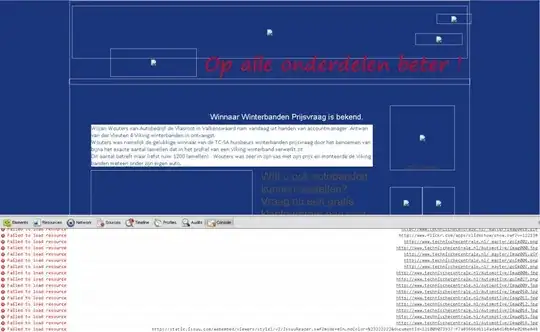
At irregular intervals, websites refuse to load, giving an error saying the page was not accessible, or some images don't load completely. Also, after inspection serveral .js files fail to get loaded.
enter image description here

Findings & What we tried:

First impression:

When I use Chrome during that interval, the site returns an net:: Error 101 or Error 103 after some refreshes. At other times, if it isn't giving the error, several images aren't visible and display an X image. IE just says the page cannot be displayed.

enter image description here

Using Chrome Developer Tools:

It shows in the console that several resources are unavailable, but when I right-click the missing images and select "Show Picture", they show. When I open up the pictures via direct URL, they also show.

enter image description here

Audit via Chrome Developer Tools:

I ran an audit on a page when it was in it's buggy state, and found out some .js files didn't load along with some .png, .jpg and .gif files. Different images load for Chrome and IE.
enter image description here enter image description here

Obfuscated JS Files & Avast:

After checking that out, I found out that most of those .js files are obfuscated JS files, and since we're running Avast 7.0.1455, I was wondering if the Web Shield didn't mess things up.

Then again, it's only happening on the first TS, not the second.

So I turned off WebShield for a day, and see if anything improved. It didn't. Back to square one.

No cache expiration on files:

Several of those files that aren't being loaded were indicated not having a cache expiration.

Caching:

One of our Sysadmins changed the IE cache size to 10MB a while back, which I thought may have been the source of the problem. He changed it back to 65MB or so, but still people run into trouble with their images. It also still happens on 1 TS, and also in Chrome, so I don't think the Group Policy dictating that cache would affect Chrome, would it?

enter image description here

Network Issue: I also thought it might be a network or routing issue, but both the TS-servers are on the same teamed NIC, and the other one is working just fine.

Help!

If anyone has some tips on where to look for issues, or needs more info, please help me out. This has been bothering me for serveral weeks now.

EDIT & UPDATE

The problem still persists, and only on our 2 Terminal Servers.

Here's what me and a colleague did so far:

  • Turn off the Antivirus for a day on one server, to see if it didn't happen. Problem still occured.

  • Checked the MTU-size
    It's the default setting (forgot the exact value :P) Problem still occured.

  • Installed Windows Updates, IE10 Problem still occured.

  • Checked if there were any proxies.
    The AV puts in a proxy as a so-called WebShield. We disabled the service and the program on one server for a day. Problem still occured.

  • Reinstalled the NIC-team as it was getting messed up. (Also reinstalled the NIC drivers) Problem still occured.

  • Checked Group Policies Apparently in both Terminal Servers, there was a Local Machine Policy that enabled Preference Mode in IE, which had some weird customisation done. Disabled that, and... Problem still occured.

It's now even gone so far as that people are having problems uploading and downloading files from SharePoint, and a lot of sites we're using aren't working due to this.

Hunches

It's either to do with the WebShield that breaks connection when it finds something peculiar, but then it shouldn't happen when the AV is turned off.

It could be that redirects are messed up somehow, or there' something with the cache. Strange though that the same issue occurs in Chrome as well as IE9 and IE10.

If anyone has any ideas, It'd be greatly appreciated.

Thanks go out to HopelessN00b for helping me out!

UPDATE:

We are getting some errors in Event Viewer like this on one of our original TS':

Error: (04/04/2013 08:44:42 AM) (Source: Application Error) (User: )
Description: Faulting application name: iexplore.exe, version: 9.0.8112.16470, time stamp: 0x510c8801
Faulting module name: MSHTML.dll, version: 9.0.8112.16470, time stamp: 0x510c9046
Exception code: 0xc0000005
Fault offset: 0x002d0174
Faulting process id: 0x21728
Faulting application start time: 0xiexplore.exe0
Faulting application path: iexplore.exe1
Faulting module path: iexplore.exe2
Report Id: iexplore.exe3

And sometimes this pops up, but apparently that's cos of some WYSE terminals being too old (replacing them with Raspberry Pi's soon hopefully).

Error: (04/04/2013 11:21:46 AM) (Source: TermDD) (User: )
Description: The Terminal Server security layer detected an error in the protocol stream and has disconnected the client.
Client IP: [IP REDACTED].

Hope this helps.

blaa
  • 211
  • 1
  • 9
  • I have made some pictures, as it happened again, but I'd need 10 rep for it. – blaa Mar 07 '13 at 09:57
  • 1
    It reminds me of problems we saw from a completely different perspective, basically it had to do with the MTU configuration, somewhere packet encapsulation hadn't been taken into consideration, and the fragmented packets were not being reassembled properly, so anything larger than a single packet just wouldn't load.. if the page was https, nothing at all would load. – NickW Mar 07 '13 at 11:35
  • Well a while back pages just plain didn't load, unless we used https, so that might be in the same direction. – blaa Mar 07 '13 at 11:39
  • I'd start looking at MTU/MRU sizes, and see if there are maybe some firewalls that don't like the way things are fragmented. It might be a re-assembly issue, basically you're going to have to use something like wireshark to see if the packets are all getting through.. – NickW Mar 07 '13 at 11:42
  • Sorry if this sounds like a networking-noob, but would WireShark have to run on the TS, or could I just run it on a server on the same network. – blaa Mar 07 '13 at 11:52
  • 1
    Not a problem, I'd try and run it somewhere between the TS and the machine(s) that are having the problems. Maybe your network guy could mirror the port where the TS is connected (or the machine you're testing from) so you could stick a machine with wireshark there to see the traffic. – NickW Mar 07 '13 at 11:59
  • Well, I checked MTU using this guide: http://www.sysadmintutorials.com/tutorials/microsoft/windows-2008-r2/how-to-set-windows-2008-r2-mtu/ And 1472 MTU seems to be the sweet spot. – blaa Mar 07 '13 at 12:46
  • 1
    Yeah, that shouldn't cause much of problem. – NickW Mar 07 '13 at 13:10
  • 1
    BTW, you've looked into something like this right: http://community.spiceworks.com/topic/293715-web-browsing-on-windows-2003-terminal-server-very-slow?source=product_26103 – NickW Mar 07 '13 at 13:11
  • Well, we don't have an ISA-server and we're using Avast Endpoint Protection Suite. Didn't find anything in their docs about flood mitigation. – blaa Mar 07 '13 at 13:22
  • 1
    Well, you've pretty much tapped my knowledge of Microsoft stuff.. sorry I couldn't help more. – NickW Mar 07 '13 at 13:49
  • 4
    there's two things I'd try when this happens. If its only the domain and JS, check the routes to the servers they are on (pathping is pretty neat there) - since if its only *some* elements, its worth working out whats the common thing and why they fail. There's also a slight chance its an ISP misconfiguration - my home ISP did this, and it was an utter pain in the ass to track down, and was fixed entirely randomly one day – Journeyman Geek Mar 28 '13 at 09:19
  • 1
    Not exactly familiar with terminal server, but this sounds suspiciously like a user saturating available ports with requests, sort of like when establishing too many P2P connections - HTTP requests take a while or just get dropped, in my experience. I would check what exactly clients were running, or perhaps, as already suggested, wireshark the traffic and see what's what. – Sašo Mar 31 '13 at 21:21
  • 1
    I would attempt to uninstall Avast altogether for an hour and test this out. I suspect it is still doing something to the pages even though it's not 'supposed' to filter/scan it. – Cold T Apr 03 '13 at 21:07
  • I have had a similar issue with some CDN sites/providers. Turned out it was DNS. I would follow along the lines of Journeyman, and troubleshoot the connection to the various CDN (or otherwise) sites that are serving up the JS and CSS etc. You may find that DNS resolution to those sites is failing (like I was), or tracert exposes an issue along the way, etc. – George Apr 04 '13 at 00:25
  • I second the suggestion to completely uninstall the AV software on the server and try again. From experience, 50% of the "just weird" things that happen at file or connection level on windows machines are caused by AV software and disabling it is often not enough: you need to remove the filters from the machine to be sure. – Stephane Apr 04 '13 at 08:00
  • We're currently running a third TS, with no AV installed. Awaiting results from that. Thanks for all the support so far! – blaa Apr 04 '13 at 08:28
  • Updated main post with additional Event Viewer info. – blaa Apr 04 '13 at 09:57
  • And another small update... After calling regularly with our ISP, the problems no longer occur (knock on wood). There's still the issue of a single site not being accesed. Apparently putting a proxy from our ISP between it solves that. – blaa Apr 17 '13 at 08:53

3 Answers3

0

Try without bonding the NICs. Setup just one NIC and see if things still work. In the event that it does make sure that your switch port configuration, and Teaming configuration line up.

Grim76
  • 1
  • Seems to me like this should be a comment, rather than an answer. Good idea, though. I've seen a faulty NIC team cause,many a weird issue in my time. – HopelessN00b Apr 03 '13 at 17:37
  • When reinstalling the NIC-team we tried to run without a team, on just a single NIC. Didn't work either. – blaa Apr 04 '13 at 08:52
0

To diagnose the problem without an accurate error message, you need to run:

  • tcpdump on client side (wireshark has a nice display)
  • tcpdump on server side (see what the server is actually sending).
  • wait for the problem to occur
  • examine the packets, and see where the communication is breaking down. If you need help examining the trace, write it to a file.

I suspect you will find an unanswered DNS query. If your ISP is filtering your traffic through a proxy, you should be able to find traces of it in the traffic, especially by comparing the server side capture to the client side capture.

If there is a network quality problem, you may be able to observe it more straightforwardly with traceroute. If the network dump shows that communications went smoothly, but the browser cannot display the data provided, then your problem is desktop funnies on the terminal server.

You should run the packet capture on the terminal server that is making the browser connection that is not working.

Des Cent
  • 41
  • 2
0

The issues has been "resolved" by the ISP. All images and JS and such are appearing normally now for a good week. The one external site not being able to be reached has been resolved by the ISP by placing a proxy between it all.

Unfortunately, the exact reason why or how this had happened still remains a mystery, but it's a safe bet there was something my ISP had changed that did the trick.

Thanks all for the support, and although a lot of answers have been very useful, I can't choose one of them to be the correct one, hence my own.

Thanks again for all your time and effort, and I hope no one else will have to cope with such networking strangeness.

blaa
  • 211
  • 1
  • 9