8

I'm having a problem when attempting to perform a PerfMon trace on a remote server. The server is Windows Server 2008 R2 SP1. The reason for performing this trace is that SQL Server seems to be grabbing a lot of memory and then not releasing it back. This behavior is not surprising but I would like to find out when and why the memory is being allocated.

Let me me first explain, that I have performed this exact trace with the these counters counters many, many times on other versions of Windows Server OS. I consider myself pretty proficient with Perf Mon. I have verified that other snap-ins are working (Computer Management for example), the Remote Registry service is running, there is no firewall turned on, and I can connect via WMI (verified seperately with PowerShell WMI commands). And I am running the MMC as my Domain Admin account, not my standard user account. This same issue occurs when attempting the steps from a Server 2008 R2 SP1 test server as well.

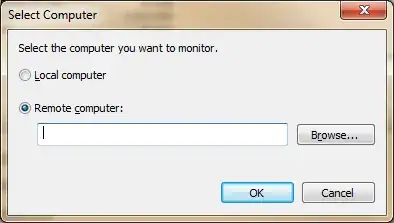
I run an MMC and add Perf Mon. The same thing happens if I just run perfom.exe directly. At this point if I attempt to change to another computer I receive the following error
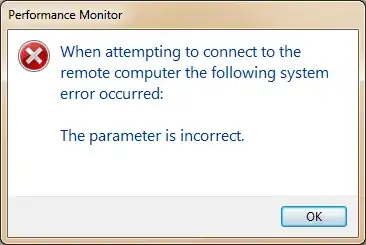
enter image description here

I then cancel that operation and try again. Add the Performance Monitor snap in and then click + to add a counter. I change the system to the remote server at that level as shown in the image
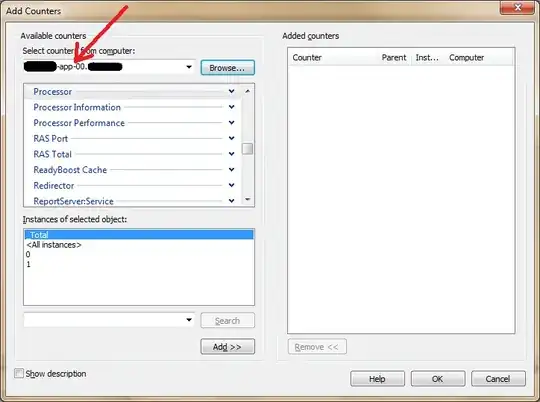
enter image description here

and things seem ok. There is latency when attempting to access the counters in each group. If I open "Physical Disks" it shows 3: C, D, E which are exactly the named physical disks on the server. On my local system the are C and G.

I add all instances of the Physical Disks: Disk Read/Sec click 'OK' and what do I see in the monitor canvas? C and G as the disks added with the Computer column populated with my local systems hostname.

A collegue suggesting this: http://blogs.technet.com/b/abizerh/archive/2009/07/15/error-the-parameter-is-incorrect-when-connecting-to-a-server-using-wmi.aspx But that seems to be for some other OS version, the author does not state which, though.

What is going on here that I am unable to run a performance monitor trace on a remote server? Thank you for any suggestions.
Robert Kaucher
  • 477
  • 1
  • 3
  • 18
  • I'm having a very similar issue when trying to connect to a Windows 7 PC from Server 2008 R2. Same error message, same behavior. Remote registry and other snap-ins work fine. Would love to have an answer to this. – pat o. Jan 16 '13 at 17:10
  • I'm still actively researching this. I'll post any answer I find. Please do the same. – Robert Kaucher Jan 16 '13 at 18:29
  • @Patrick - Did my solution help in your case at all? – Robert Kaucher Jan 17 '13 at 15:11
  • This doesn't help you solve your monitoring question, but the symptoms you describe, "SQL Server grabs a lot of memory and does not release it back" is normal and intentional for performance reasons. – Dan Sorensen May 12 '15 at 15:39

3 Answers3

4

I found this article that details some steps about rebuilding PerfMon settings.

http://support.microsoft.com/kb/300956

I then ran the following in an elevated command prompt:

cd /d %systemroot%\system32
lodctr /r
cd /d %systemroot%\syswow64
lodctr /r

I then ran MMC and addred PerfMon. Initially I received the same error that the parameter was incorrect. Then I attempted to just add counter and the MMC seemed to "stutter" I was able to finally add remote counters. I then deleted the remote counters and attempted to connect to a remote server and saw this

enter image description here

rather than the error message. It connected correctly and is currently collecting my counters from the remote system.

Ro Yo Mi
  • 308
  • 2
  • 10
Robert Kaucher
  • 477
  • 1
  • 3
  • 18
0

The reason for performing this trace is that SQL Server seems to be grabbing a lot of memory and then not releasing it back.

SQL server can allocate memory in different ways, depending on configuration and need.

You can monitor this by checking the various "SQL Server: Buffer Manager" and "SQL Server: Memory" performance counters, but I can tell you from experience that the large majority of memory is used for the buffer cache, i.e. caching data pages from disk.
The memory MSSQL uses for running its processes, executing queries, and storing compiled execution plans, is at most 5% to 10% of the total amount of memory it can use. The rest is all cache (cache is good).

If you want to know if the amount of memory available to MSSQL is enough, you only need to monitor one performance counter: "SQL Server: Buffer manager\Page Life Expectancy".

This value should never fall below a few minutes, and ideally be in the range of an hour or more.

If you have not touched the installation defaults, it will use as much memory as it requires, up to the maximum available to the OS.

If this is undesired, reduce the "Maximum Server Memory" value in the Memory tab of the Server Properties window.

Pressing OK will run sp_reconfigure, and that is the most memory SQL server will use from then on.

adaptr
  • 16,479
  • 21
  • 33
  • I understand that. My question is in regards to PerfMon. I will edit it to make that explicit. My mention of why I was running perfmon was simply for background in the case that it might provide information in regards to the PerfMon issue (which is not likely). – Robert Kaucher Jan 14 '13 at 16:56
0

Another thing to consider is Click Properties (icon on the top) --> General Tab --> Change “Run as “to the windows account that has permissions in remote machine

sathiq
  • 1