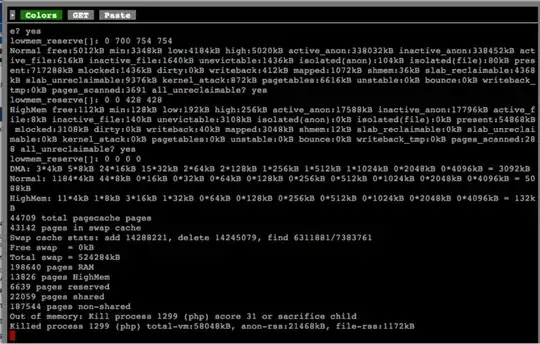
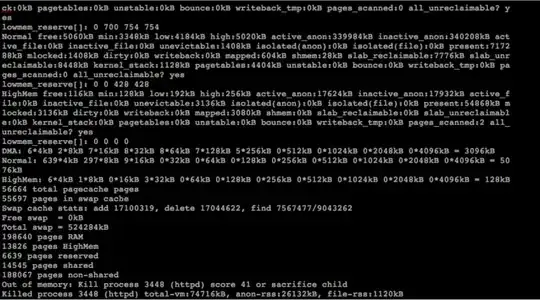
I have a 1GB RAM Linode on a CentOS LAMP running Drupal Aegir with just 3 Open Atrium sites, and about 10-20 concurrent users. At random times, it pukes an Out of Memory kill. I can't figure out what's causing it. I'm not sure if i need to do some memory usage tweaking on my CentOS LAMP stack. It appears Apache and/or PHP is causing problems. I have an MPM prefork on Apache. I need to get this under control quickly.. After a couple hours of a crash and burn OOM, here's some info. To my eye, it doesn't look like anything is wrong... Here's a bunch of juicy details. I'm hoping someone smarter than me can shed some light. I've included, config and performance info below. First the Linode OOM kills...
OOM Kill#1 screenshot
OOM Kill#2 screenshot
Type of MPM in use by Apache
httpd -V | grep 'MPM'
Server MPM: Prefork
-D APACHE_MPM_DIR="server/mpm/prefork"
Current settings in my httpd.conf
<IfModule prefork.c>
StartServers 8
MinSpareServers 5
MaxSpareServers 20
ServerLimit 256
MaxClients 256
MaxRequestsPerChild 4000
Now, here are my running processes
ps aux
USER       PID %CPU %MEM    VSZ   RSS TTY      STAT START   TIME COMMAND
root         1  0.0  0.0   2208   568 ?        Ss   10:20   0:01 init [3]
root         2  0.0  0.0      0     0 ?        S    10:20   0:00 [kthreadd]
root         3  0.0  0.0      0     0 ?        S    10:20   0:00 [ksoftirqd/0]
root         5  0.0  0.0      0     0 ?        S    10:20   0:00 [kworker/u:0]
root         6  0.0  0.0      0     0 ?        S    10:20   0:00 [migration/0]
root         7  0.0  0.0      0     0 ?        S    10:20   0:00 [migration/1]
root         9  0.0  0.0      0     0 ?        S    10:20   0:00 [ksoftirqd/1]
root        10  0.0  0.0      0     0 ?        S    10:20   0:00 [migration/2]
root        12  0.0  0.0      0     0 ?        S    10:20   0:00 [ksoftirqd/2]
root        13  0.0  0.0      0     0 ?        S    10:20   0:00 [migration/3]
root        15  0.0  0.0      0     0 ?        S    10:20   0:00 [ksoftirqd/3]
root        16  0.0  0.0      0     0 ?        S<   10:20   0:00 [cpuset]
root        17  0.0  0.0      0     0 ?        S<   10:20   0:00 [khelper]
root        18  0.0  0.0      0     0 ?        S    10:20   0:00 [kdevtmpfs]
root        19  0.0  0.0      0     0 ?        S    10:20   0:00 [kworker/u:1]
root        21  0.0  0.0      0     0 ?        S    10:20   0:00 [xenwatch]
root        22  0.0  0.0      0     0 ?        S    10:20   0:00 [xenbus]
root       162  0.0  0.0      0     0 ?        S    10:20   0:00 [sync_supers]
root       164  0.0  0.0      0     0 ?        S    10:20   0:00 [bdi-default]
root       166  0.0  0.0      0     0 ?        S<   10:20   0:00 [kblockd]
root       174  0.0  0.0      0     0 ?        S    10:20   0:00 [kworker/3:1]
root       178  0.0  0.0      0     0 ?        S<   10:20   0:00 [md]
root       262  0.0  0.0      0     0 ?        S<   10:20   0:00 [rpciod]
root       275  0.0  0.0      0     0 ?        S    10:20   0:01 [kswapd0]
root       276  0.0  0.0      0     0 ?        SN   10:20   0:00 [ksmd]
root       277  0.0  0.0      0     0 ?        S    10:20   0:00 [fsnotify_mark]
root       281  0.0  0.0      0     0 ?        S    10:20   0:00 [ecryptfs-kthr]
root       283  0.0  0.0      0     0 ?        S<   10:20   0:00 [nfsiod]
root       284  0.0  0.0      0     0 ?        S<   10:20   0:00 [cifsiod]
root       287  0.0  0.0      0     0 ?        S    10:20   0:00 [jfsIO]
root       288  0.0  0.0      0     0 ?        S    10:20   0:00 [jfsCommit]
root       289  0.0  0.0      0     0 ?        S    10:20   0:00 [jfsCommit]
root       290  0.0  0.0      0     0 ?        S    10:20   0:00 [jfsCommit]
root       291  0.0  0.0      0     0 ?        S    10:20   0:00 [jfsCommit]
root       292  0.0  0.0      0     0 ?        S    10:20   0:00 [jfsSync]
root       293  0.0  0.0      0     0 ?        S<   10:20   0:00 [xfsalloc]
root       294  0.0  0.0      0     0 ?        S<   10:20   0:00 [xfs_mru_cache]
root       295  0.0  0.0      0     0 ?        S<   10:20   0:00 [xfslogd]
root       296  0.0  0.0      0     0 ?        S<   10:20   0:00 [glock_workque]
root       297  0.0  0.0      0     0 ?        S<   10:20   0:00 [delete_workqu]
root       298  0.0  0.0      0     0 ?        S<   10:20   0:00 [gfs_recovery]
root       299  0.0  0.0      0     0 ?        S<   10:20   0:00 [crypto]
root       862  0.0  0.0      0     0 ?        S    10:20   0:00 [khvcd]
root       978  0.0  0.0      0     0 ?        S<   10:20   0:00 [kpsmoused]
root       979  0.0  0.0      0     0 ?        S    10:20   0:01 [kworker/1:1]
root       982  0.0  0.0      0     0 ?        S    10:20   0:00 [kworker/2:1]
root      1017  0.0  0.0      0     0 ?        S<   10:20   0:00 [deferwq]
root      1020  0.0  0.0      0     0 ?        S    10:20   0:00 [kjournald]
root      1044  0.0  0.0      0     0 ?        S    10:20   0:00 [kauditd]
root      1077  0.0  0.0   2424   364 ?        S<s  10:20   0:00 /sbin/udevd -d
root      2734  0.0  0.0      0     0 ?        S    10:20   0:00 [flush-202:0]
root      2780  0.0  0.0   2452    40 ?        Ss   10:20   0:00 /sbin/dhclient
root      2847  0.0  0.0  10624   464 ?        S<sl 10:20   0:00 auditd
root      2849  0.0  0.0  11184   572 ?        S<sl 10:20   0:00 /sbin/audispd
root      2869  0.0  0.0   1964   628 ?        Ss   10:20   0:00 syslogd -m 0
root      2872  0.0  0.0   1808   292 ?        Ss   10:20   0:00 klogd -x
named     2913  0.0  0.1  58936  1752 ?        Ssl  10:20   0:00 /usr/sbin/named
dbus      2935  0.0  0.0   2896   808 ?        Ss   10:20   0:00 dbus-daemon --s
root      2971  0.0  0.0  23268   828 ?        Ssl  10:20   0:01 automount
root      2990  0.0  0.0   7256   748 ?        Ss   10:20   0:00 /usr/sbin/sshd
ntp       3004  0.0  0.4   4548  4544 ?        SLs  10:20   0:01 ntpd -u ntp:ntp
root      3015  0.0  0.0   5344   176 ?        Ss   10:20   0:00 /usr/sbin/vsftp
root      3051  0.0  0.0   4676   956 ?        S    10:20   0:00 /bin/sh /usr/bi
mysql     3143 13.5  1.2 124592 12888 ?        Sl   10:20  56:33 /usr/libexec/my
root      3181  0.0  0.0   9372  1020 ?        Ss   10:20   0:00 sendmail: accep
smmsp     3189  0.0  0.1   8280  1152 ?        Ss   10:20   0:00 sendmail: Queue
root      3198  0.0  0.0   2044   224 ?        Ss   10:20   0:00 gpm -m /dev/inp
root      3215  0.0  0.1   5384  1092 ?        Ss   10:21   0:00 crond
xfs       3233  0.0  0.0   3308   780 ?        Ss   10:21   0:00 xfs -droppriv -
root      3349  0.0  0.0   2408   332 ?        Ss   10:21   0:00 /usr/sbin/atd
root      3372  0.0  1.0  26696 10704 ?        SN   10:21   0:00 /usr/bin/python
root      3374  0.0  0.0   2704   832 ?        SN   10:21   0:01 /usr/libexec/ga
root      3375  0.0  1.3  19420 13676 ?        Ss   10:21   0:02 /usr/bin/perl /
root      3378  0.0  0.0   1792   428 hvc0     Ss+  10:21   0:00 /sbin/mingetty
apache    5161  0.1  3.5  53992 36252 ?        S    14:28   0:11 /usr/sbin/httpd
apache    5162  0.0  3.5  53880 36104 ?        S    14:28   0:09 /usr/sbin/httpd
apache    5163  0.1  3.5  54128 36424 ?        S    14:28   0:13 /usr/sbin/httpd
root     18629  0.0  0.9  27828  9596 ?        Ss   12:09   0:01 /usr/sbin/httpd
apache   18631  0.0  3.4  53064 35476 ?        S    12:09   0:15 /usr/sbin/httpd
apache   18632  0.0  3.5  53636 35984 ?        S    12:09   0:15 /usr/sbin/httpd
apache   18633  0.1  3.4  53340 35816 ?        S    12:09   0:19 /usr/sbin/httpd
apache   18634  0.1  3.6  54936 37544 ?        S    12:09   0:20 /usr/sbin/httpd
apache   18635  0.0  3.5  53928 36328 ?        S    12:09   0:14 /usr/sbin/httpd
apache   18636  0.1  3.4  53080 35636 ?        S    12:09   0:20 /usr/sbin/httpd
apache   18637  0.0  3.4  53072 35364 ?        S    12:09   0:12 /usr/sbin/httpd
apache   18638  0.0  3.5  53680 36336 ?        S    12:09   0:15 /usr/sbin/httpd
apache   18751  0.1  3.4  53492 35924 ?        S    12:10   0:22 /usr/sbin/httpd
root     19122  0.0  0.0      0     0 ?        S    16:08   0:00 [kworker/3:2]
root     21015  0.0  0.0      0     0 ?        S    16:22   0:00 [kworker/2:2]
root     22764  0.0  0.0      0     0 ?        S    16:36   0:00 [kworker/0:2]
apache   23494  0.1  3.5  53884 36288 ?        S    12:45   0:17 /usr/sbin/httpd
apache   23498  0.1  4.1  60572 42756 ?        S    12:45   0:19 /usr/sbin/httpd
root     23996  0.0  0.0      0     0 ?        S    16:44   0:00 [kworker/1:0]
root     27059  0.0  0.2  10108  2940 ?        Rs   17:06   0:00 sshd: root@pts/
root     27168  0.0  0.1   4812  1456 pts/0    Ss   17:07   0:00 -bash
root     27464  0.0  0.0      0     0 ?        S    17:09   0:00 [kworker/0:1]
root     28565  0.0  0.0   4400   928 pts/0    R+   17:17   0:00 ps aux
Free Usage stats
free -m
              total       used       free     shared    buffers     cached
Mem:          1003        655        347          0         29        151
-/+ buffers/cache:        474        528
Swap:          511         13        498
List of running processes sorted by memory use
ps -eo pmem,pcpu,rss,vsize,args | sort -k 1 -r | less
%MEM %CPU   RSS    VSZ COMMAND
4.1  0.1 42756  60572 /usr/sbin/httpd
3.6  0.1 37544  54936 /usr/sbin/httpd
3.5  0.1 36424  54128 /usr/sbin/httpd
3.5  0.1 36288  53884 /usr/sbin/httpd
3.5  0.1 36252  53992 /usr/sbin/httpd
3.5  0.0 36336  53680 /usr/sbin/httpd
3.5  0.0 36328  53928 /usr/sbin/httpd
3.5  0.0 36104  53880 /usr/sbin/httpd
3.5  0.0 35984  53636 /usr/sbin/httpd
3.4  0.1 35924  53492 /usr/sbin/httpd
3.4  0.1 35816  53340 /usr/sbin/httpd
3.4  0.1 35636  53080 /usr/sbin/httpd
3.4  0.0 35628  53328 /usr/sbin/httpd
3.4  0.0 35476  53064 /usr/sbin/httpd
1.3 13.5 13792 125496 /usr/libexec/mysqld --basedir=/usr --datadir=/var/lib/mysql --user=mysql --log-error=/var/log/mysqld.log --pid-file=/var/run/mysqld/mysqld.pid --socket=/var/lib/mysql/mysql.sock
1.3  0.0 13676  19420 /usr/bin/perl /usr/libexec/webmin/miniserv.pl /etc/webmin/miniserv.conf
1.0  0.0 10708  26696 /usr/bin/python -tt /usr/sbin/yum-updatesd
0.9  0.0  9596  27828 /usr/sbin/httpd
0.4  0.0  4544   4548 ntpd -u ntp:ntp -p /var/run/ntpd.pid -g
iostat
avg-cpu:  %user   %nice %system %iowait  %steal   %idle
          6.72    0.03    2.39    0.50    0.49   89.89

Device:            tps   Blk_read/s   Blk_wrtn/s   Blk_read   Blk_wrtn
xvda              6.00       138.91       123.01    3397138    3008160
xvdb              0.06         0.15         1.11       3576      27040
iostat -d -x 2 5
Device:         rrqm/s   wrqm/s   r/s   w/s   rsec/s   wsec/s avgrq-sz avgqu-sz   await  svctm  %util
xvda              0.07    12.07  2.72  3.27   138.36   122.77    43.61     0.38   62.71   4.77   2.86
xvdb              0.00     0.09  0.01  0.05     0.15     1.10    20.51     0.00   48.04   3.10   0.02

Device:         rrqm/s   wrqm/s   r/s   w/s   rsec/s   wsec/s avgrq-sz avgqu-sz   await  svctm  %util
xvda              0.00     0.00  0.00  0.00     0.00     0.00     0.00     0.00    0.00   0.00   0.00
xvdb              0.00     0.00  0.00  0.00     0.00     0.00     0.00     0.00    0.00   0.00   0.00

Device:         rrqm/s   wrqm/s   r/s   w/s   rsec/s   wsec/s avgrq-sz avgqu-sz   await  svctm  %util
xvda              0.00     0.00  3.00  0.00    36.00     0.00    12.00     0.02    6.00   6.00   1.80
xvdb              0.00     0.00  0.00  0.00     0.00     0.00     0.00     0.00    0.00   0.00   0.00