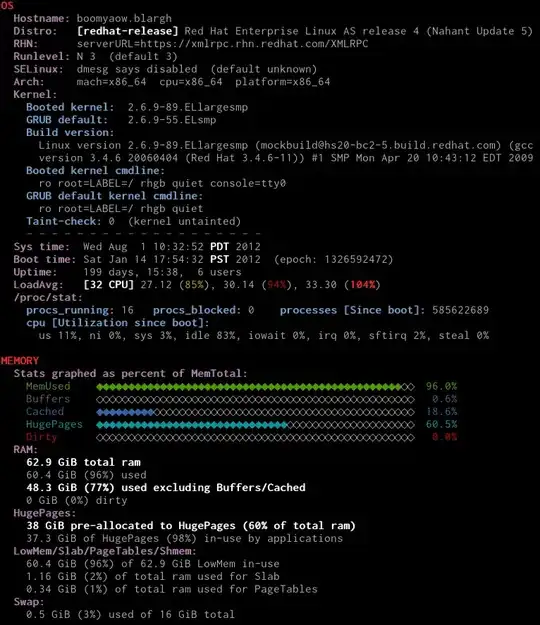
I recently stumbled across another tool called xsos which can also analyze the contents of a sosreport output payload.
[rsaw]$ xsos aczx998pinkle/
OS
  Hostname: aczx998pinkle
  Distro:   [redhat-release] Red Hat Enterprise Linux Server release 5.5 (Carthage)
            [enterprise-release] Enterprise Linux Enterprise Linux Server release 5.5 (Carthage)
  RHN:      serverURL=https://linux-update.oracle.com/XMLRPC
  Runlevel: N 3  (default 3)
  SELinux:  permissive  (default enforcing)
  Arch:     mach=x86_64  cpu=x86_64  platform=x86_64
  Kernel:
    Booted kernel:  2.6.18-238.12.2.0.2.el5
    GRUB default:   2.6.18-238.12.2.0.2.el5
    Build version:
      Linux version 2.6.18-238.12.2.0.2.el5 (mockbuild@ca-build9.us.oracle.com) (gcc version 4.1.2
      20080704 (Red Hat 4.1.2-50)) #1 SMP Tue Jun 28 05:21:19 EDT 2011
    Booted kernel cmdline:
      root=/dev/md6 ro bootarea=c0d0 loglevel=7 panic=60 debug rhgb numa=off console=ttyS0,115200n8
      console=tty1 crashkernel=128M@16M bootfrom=CELLBOOT audit=1 processor.max_cstate=1 nomce
    GRUB default kernel cmdline:
      root=/dev/md6 ro bootarea=c0d0 loglevel=7 panic=60 debug rhgb numa=off console=ttyS0,115200n8
      console=tty1 crashkernel=128M@16M bootfrom=BOOT audit=1 processor.max_cstate=1 nomce
    Kernel taint-check: 536870912 512 64 16 1
      Technology Preview code is loaded
      Taint on warning
      Userspace-defined naughtiness
      System experienced a machine check exception
      Proprietary module has been loaded
    - - - - - - - - - - - - - - - - - - -
  Sys time:  Mon Oct 29 10:55:02 CDT 2012
  Boot time: Sat Apr 28 03:29:56 CDT 2012  (1335583796)
  Uptime:    184 days, 12:25,  1 user
  LoadAvg:   [24 CPU] 2.34 (10%), 1.27 (5%), 0.95 (4%)
  /proc/stat:
    procs_running: 4    procs_blocked: 1    processes: 248052571
    cpu:  [Break-down of CPU time since boot]
      us 1%, ni 0%, sys 1%, idle 96%, iowait 2%, irq 0%, sftirq 0%, steal 0%
Similar example, xsos -om -or- xsos --os --mem, showing off color output:

References
